


Processes
- Click 'Tools' > 'Open KillSwitch'
- Click the 'Services' tab on the KillSwitch home screen
- Click the 'Processes' stripe to expand the area. The default view is all running processes.
- Different colors are used for different types of processes and the process status. Clicking 'Options' > 'Configure Highlighting' to configure these colors.
- Right-click on a process to stop, restart, set process priority, view properties etc.
- You can select multiple process by holding the 'Ctrl' key.
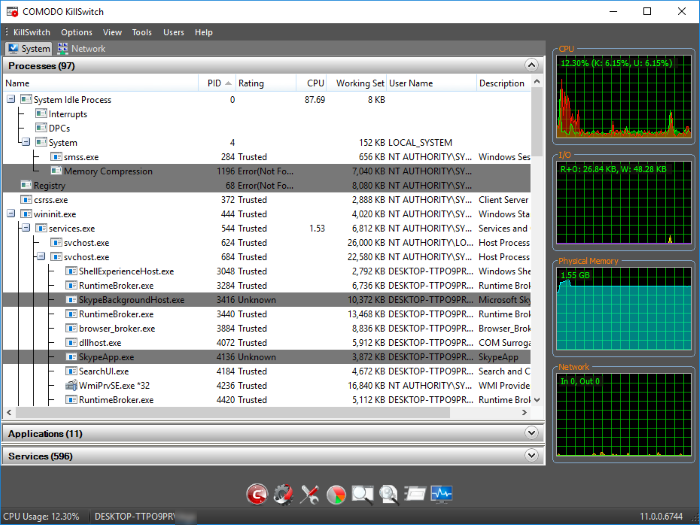
The table below shows the default table columns. You can add or remove columns in 'View' > 'Select Columns'.
|
Process Table - Descriptions of Columns |
|
|---|---|
|
Column |
Description |
|
Name |
Shows the file name that created the processes.You can sort entries in ascending or descending order by clicking on the names column header. |
|
PID |
Lists the process identification number.You can sort entries in ascending or descending order by clicking on the PID column header. |
|
Rating |
Trust rating of the process. Trusted - The process is on our white-list and is verified as safe to run. Untrusted - A process with an 'unknown' trust rating. The process is not in our malware blacklist, but is also not on our whitelist of safe processes. |
|
Signer |
The name of the entity that digitally signed the software. This is usually the company that created the software behind the process. |
|
CPU |
Processor usage as a percent of total available processor power. |
|
Working Set |
The
number of page files in virtual memory referenced by the process. Background Note: The working set is the collection of information referenced by the process.Collections are stored as page files in secondary memory. |
|
User Name |
The user that started the process. |
|
Description |
Additional information about the process. This is usually provided by the software vendor to explain the purpose of the process. |
| Network Received Traffic |
The total volume of traffic data received by the process since opening KillSwitch. |
| Network Send Traffic |
The total volume of traffic data sent by the process since opening KillSwitch. |
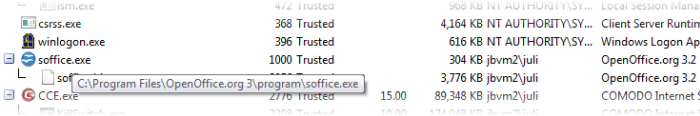
- Place your mouse over a process to view the location of the process:
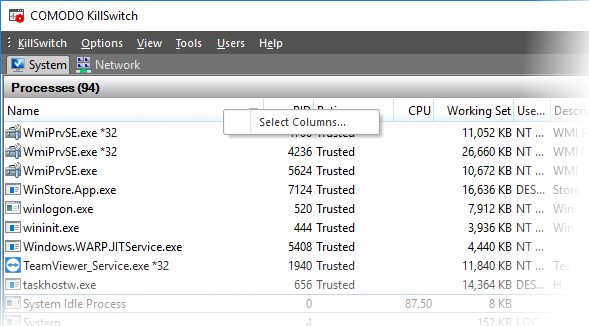
If you wish to view more details on each process, you can add more columns to the table:
- Click 'View ' > 'Select Columns'
Or
- Right-click on the table header and select 'Select Columns' from the context sensitive menu.
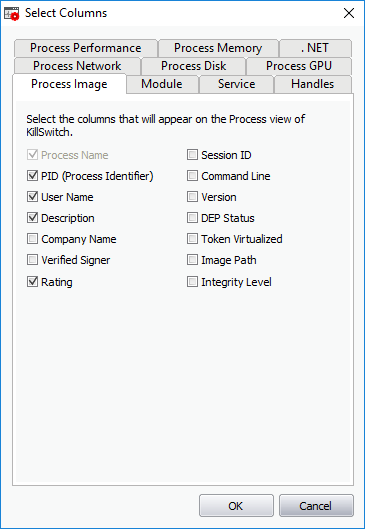
Click the tab which corresponds to the interface whose columns you want to configure:
See the following for more details on each tab:
- .Net
The process image tab lets you select which columns are shown in the ‘Process’ window. The columns in this tab provide general information about the process.
-
Use the check-boxes to specify which columns are shown in the process list
- Click 'OK' for your configuration to take effect.
The process performance tab lets you select which columns are shown in the 'Process' window to provide the detailed statistics and performance information like CPU usage, I/O activity and so on. This data is useful to track the resource overhead of a process at a granular level.
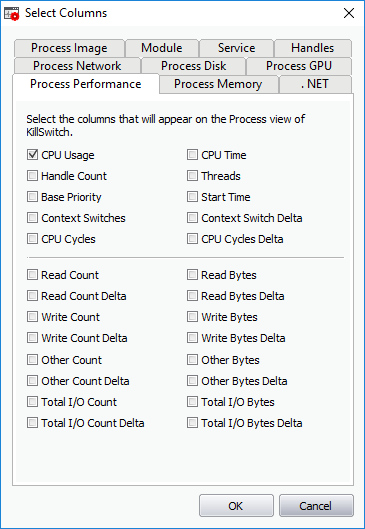
- Use the check-boxes to specify which columns are shown in the process list.
- Click 'OK' for your configuration to take effect.
The process memory tab lets you select which columns are shown in the 'Process' window. These columns provide granular details about the memory usage of a process.
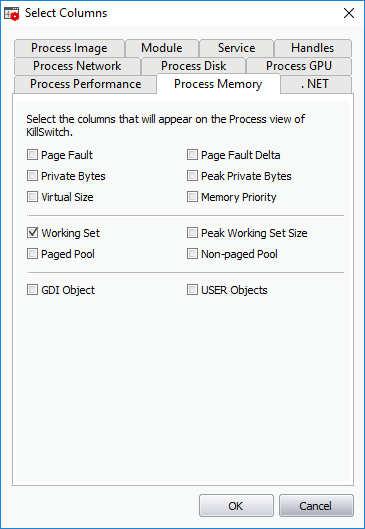
- Use the check-boxes to specify which columns are shown in the process list.
-
Click 'OK' for your configuration to take effect.
The process disk tab lets you select which columns are shown in 'Processes' window. This data is useful to track disk access activities by processes.
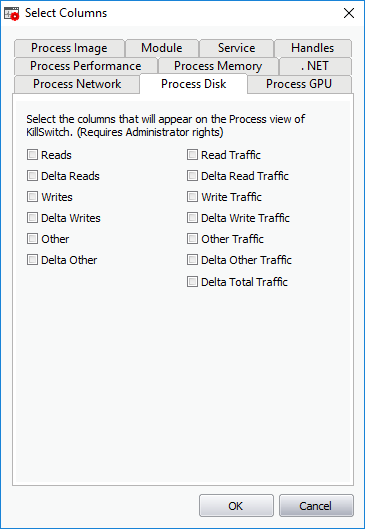
- Use the check-boxes to specify which columns are shown in the process list.
- Click 'OK' for your configuration to take effect.
The process network window lets you configure which columns are shown in 'Process' list. This is useful to track how and which processes are handling network traffic. This data helps to monitor and log internet usage, to provide details which applications consumed that data.
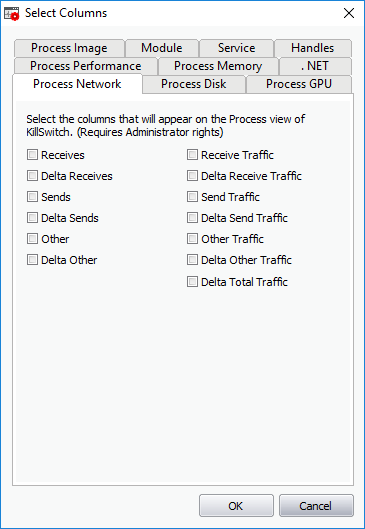
- Use the check-boxes to specify which columns are shown in the process list.
-
Click 'OK' for your configuration to take effect.
Process GPU
The GPU processing tab lets you configure which columns are shown in under the 'GPU' area. This is useful to track how and which processes are handling graphic memory. This processor manipulates computer graphics and renders images.
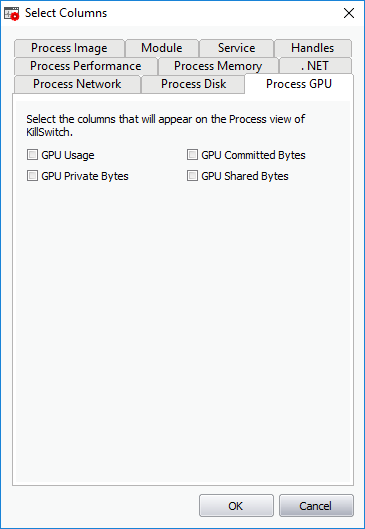
- Use the check-boxes to specify which columns are shown in the process list.
- Click 'OK' for your configuration to take effect.
The .Net tab lets you configure which columns are shown in the '.Net performance' tab. Each column provides insight into the performance of .NET on your system.
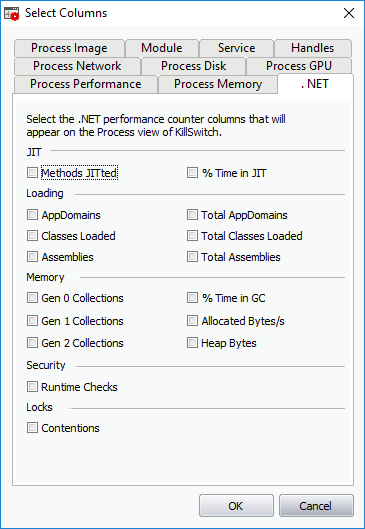
Use the check-boxes to specify which columns are shown in the process list.
- Click 'OK' for your configuration to take effect.
The module tab lets you configure the columns shown in the 'Modules' tab. See View Properties of a Process > Modules for more details on the 'Properties' dialog and the 'Modules' tab.
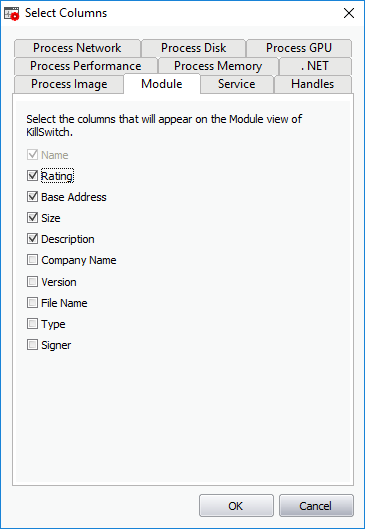
- Use the check-boxes to specify which columns are shown in the process list.
- Click 'OK' for your configuration to take effect.
The service tab lets you select which columns are shown in the 'Services' window. See Services > Column Selection for more details.
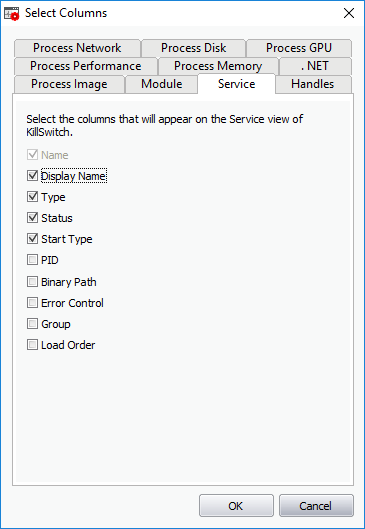
- Use the check-boxes to specify which columns are shown in the process list.
- Click 'OK' for your configuration to take effect.
Handles
The handles tab lets you select which columns are shown in the 'Handles' window. For more details on the Properties dialog and the 'Handles' tab. See View Properties of a Process > Handles for more details on the properties dialog and the handles tab.
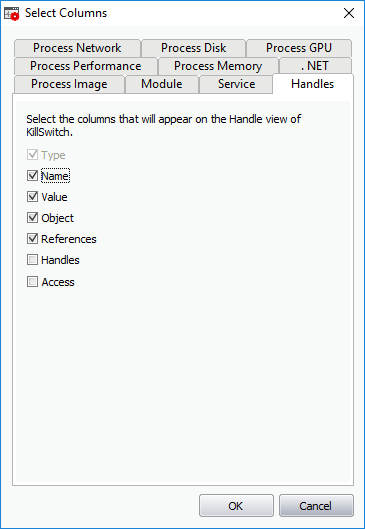
- Use the check-boxes to specify which columns are shown in the process list.
- Click 'OK' for your configuration to take effect