


Configure KillSwitch
The 'Options' menu lets you configure 'KillSwitch' at a granular level:
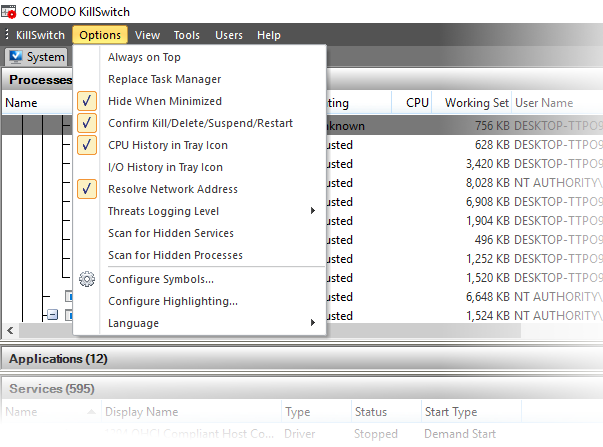
- Always on Top – When non-minimized, the KillSwitch window is always visible ahead of any other applications. Other applications will appear in the background.
- Replace Task Manager – All methods used to open Windows Task Manager will instead open KillSwitch. Example methods include:
- Ctrl + Alt + Del > Click 'Task Manager'
- Right-click on the Windows task-bar and click 'Task Manager' Task Bar
- Hide When Minimized - KillSwitch automatically hides itself when it is minimized. You can double-click on the system tray icon to reopen the application.
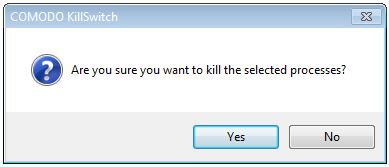
- Confirm Kill/Delete/Suspend/Restart – KillSwitch shows a confirmation dialog whenever you take actions on a process:
- CPU History in Tray Icon – A KillSwitch icon is shown in the system tray at the bottom-right corner of the screen.The icon provides a fast way to open or close the application, shutdown your system and so on. See 'The System Tray Icon' for more details.
- I/O History in Tray Icon – The tray icon shows graphics to represent the input/output activities of your computer.
- Resolve Network Address - If enabled, KillSwitch shows host names in the 'Local Address' and 'Remote Address' columns in the 'Network Connections' window. If not enabled, only the IP addresses of the local host and remote hosts are shown.
- Threats Log Level - Allows you to select the option for creating log reports. Hovering the mouse over Threats Log Level displays a sub-menu with the three options:
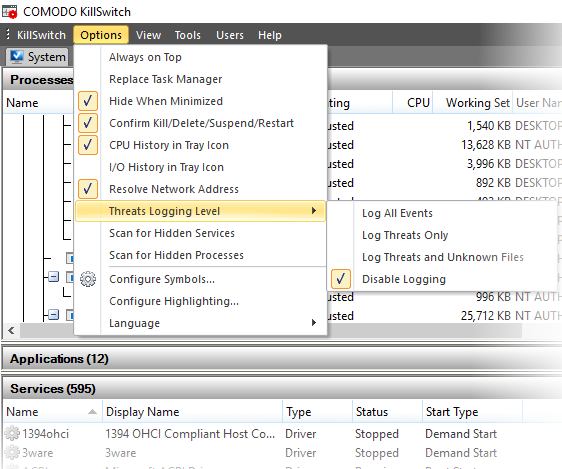
- Log All Events – Record every event that takes place. This produces the most comprehensive reports but at the cost of larger file sizes.
- Log Threats Only – Record only those events where KillSwitch detected a malicious process or service.
- Log Threats and Unknown Files - Record events which concern malicious processes, and processes for which no trust rating exists. 'Unknown' processes have not yet been tested to establish whether they are safe to run or not.
- Disable Logging - Do not record any events.
- Scan for Hidden Services - KillSwitch will run an instant scan for services running in the background
- Scan for Hidden Processes - KillSwitch will run an instant scan for programs running invisibily
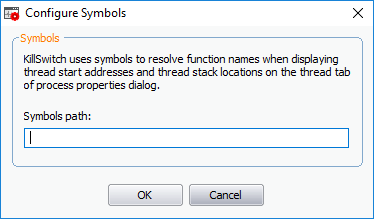
- Configure Symbols – KillSwitch uses the program database symbols to resolve their function names to find the start addresses and stack locations of threads.
- This is displayed in the 'Threads' tab of the process in properties dialog.
- If you have relocated the pdb files, you can specify the new path of the file through this option.
The highlighting screen lets you change these color to your preferences:
- Click 'Tools' > 'Configure Highlighting'
- KillSwitch color codes processes as follows:
- Processes window - Running, stopped, suspicious or hidden processes
- Applications window - New applications and applications that are closing
- Services window - New services and services that are closing
- Network Connections window - New connections and connections that are closing
- Graphs (on the right) – Various colors to represent different resources
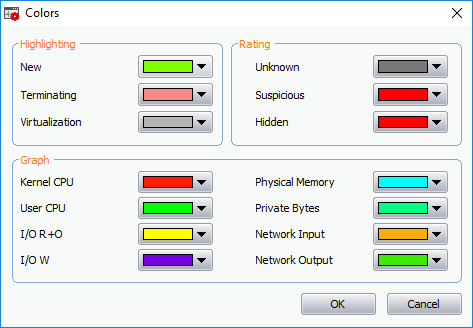
- Highlighting– Set the colors you want to use for various process statuses
- Rating – Set the colors you want to use for the trust rating of a process
- Graph– Select the color of each line on a KillSwitch chart:
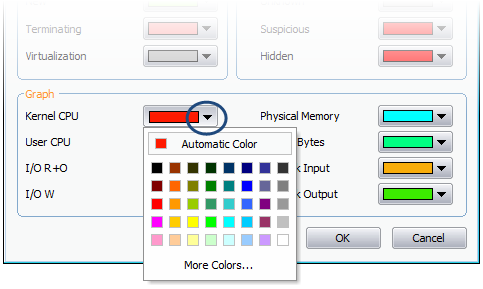
To change the color of a desired line
- CPU usage by Kernel
- CPU usage by User initiated applications and processes
- I/O Read Only
- I/O Write
- Physical Memory Usage
- Private Bytes
- Network Input
- Network Output
-
Click on the color patch beside the required parameter. The 'Color' window opens with the default color selected.
-
Choose the color for highlighting or the graph line. You can do this by two ways:
- Directly choose the color from the palate; or
- Click on 'More Colors...' to add a custom color to the palate and select it.
-
Click 'OK'.
The highlighting and/or graph lines will be displayed with the colors you have chosen.
- Language - KillSwitch is available in several language. Hovering the mouse cursor over 'Language' in the 'Options' menu shows the list of languages. You can select the language for application from the list.