


Incidents
- Click 'Managed Security' > 'Service', scroll to 'Customer Health', click the three-dot button on the customer's row and click 'Incidents Overview' to open this interface.
The 'Incidents Overview' page is the incident queue for one customer. It counts the incidents by severity, lists them with the detection time and what was done about them, and lets you search the queue by identifier, name, action, category, source or destination.
You can switch between customers, change the date window, filter by severity, search the queue and sort the list by most of its columns.
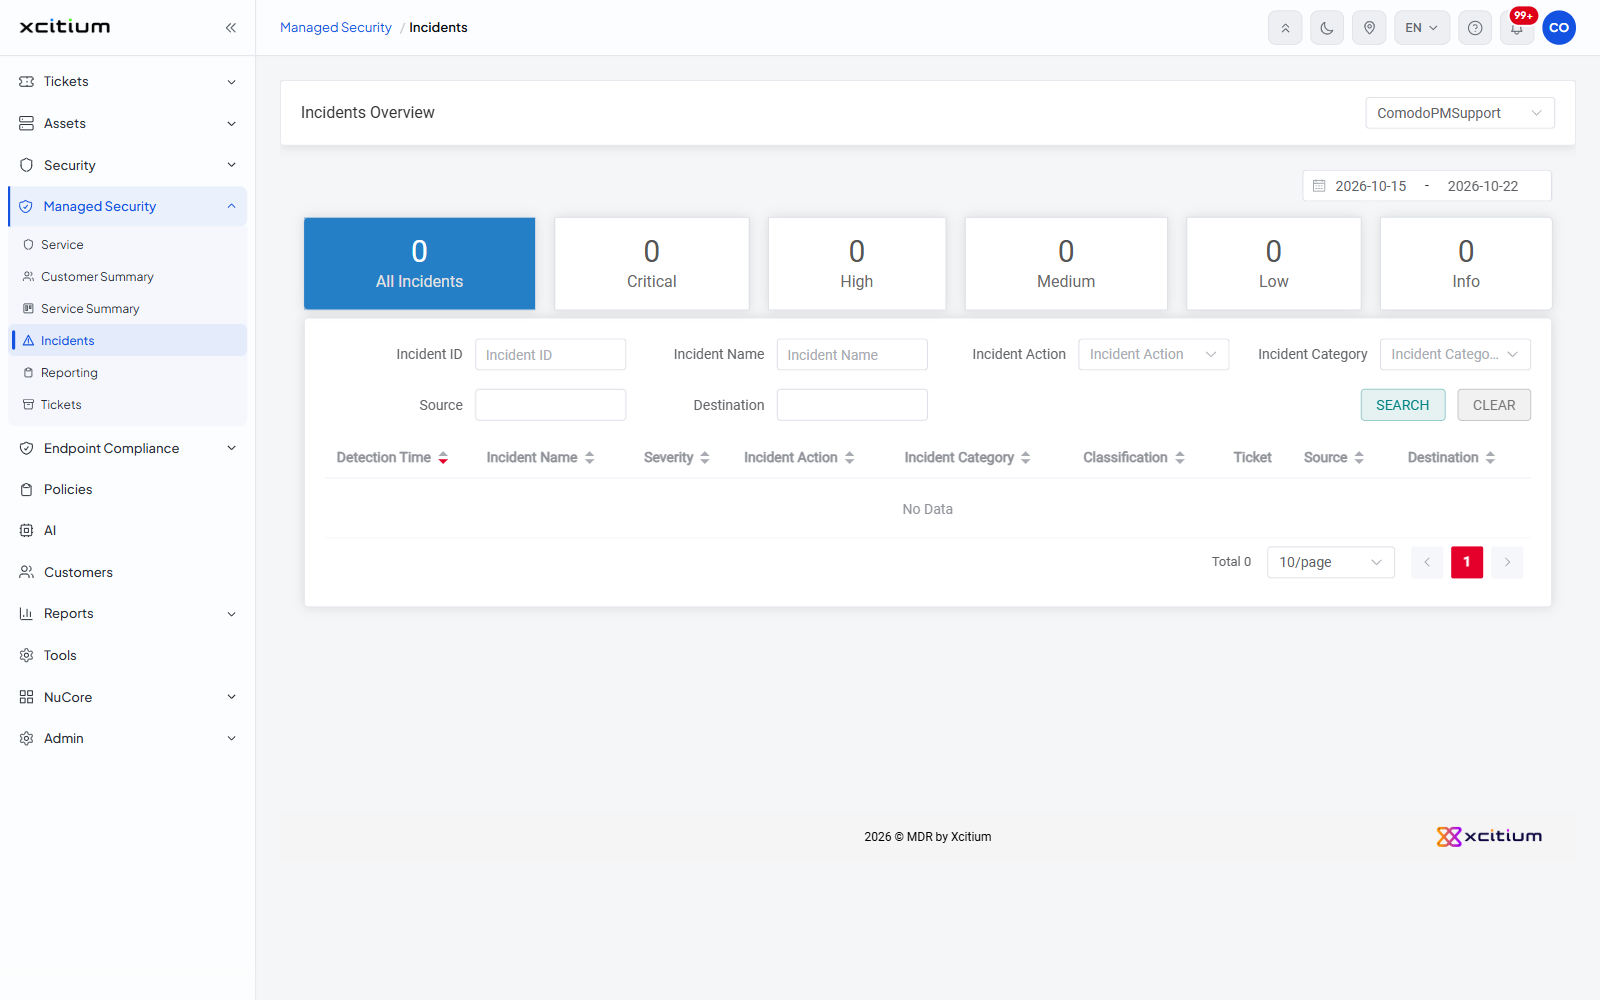
Page header
| Control | Description |
| Customer selector | Top right of the header. Lists every customer in your account. The page always reports on one customer. |
| Date range | Under the header. Two dates with a calendar icon, giving the start and end of the window the page reports on. |
Severity tiles
Six tiles run across the page. Each shows a count and acts as a filter on the list below — click a tile to show only that severity. The selected tile is shaded.
| Tile | Description |
| All Incidents | Every incident in the window, whatever its severity. This tile is selected when the page opens. |
| Critical | Incidents at critical severity. |
| High | Incidents at high severity. |
| Medium | Incidents at medium severity. |
| Low | Incidents at low severity. |
| Info | Incidents recorded for information only. |
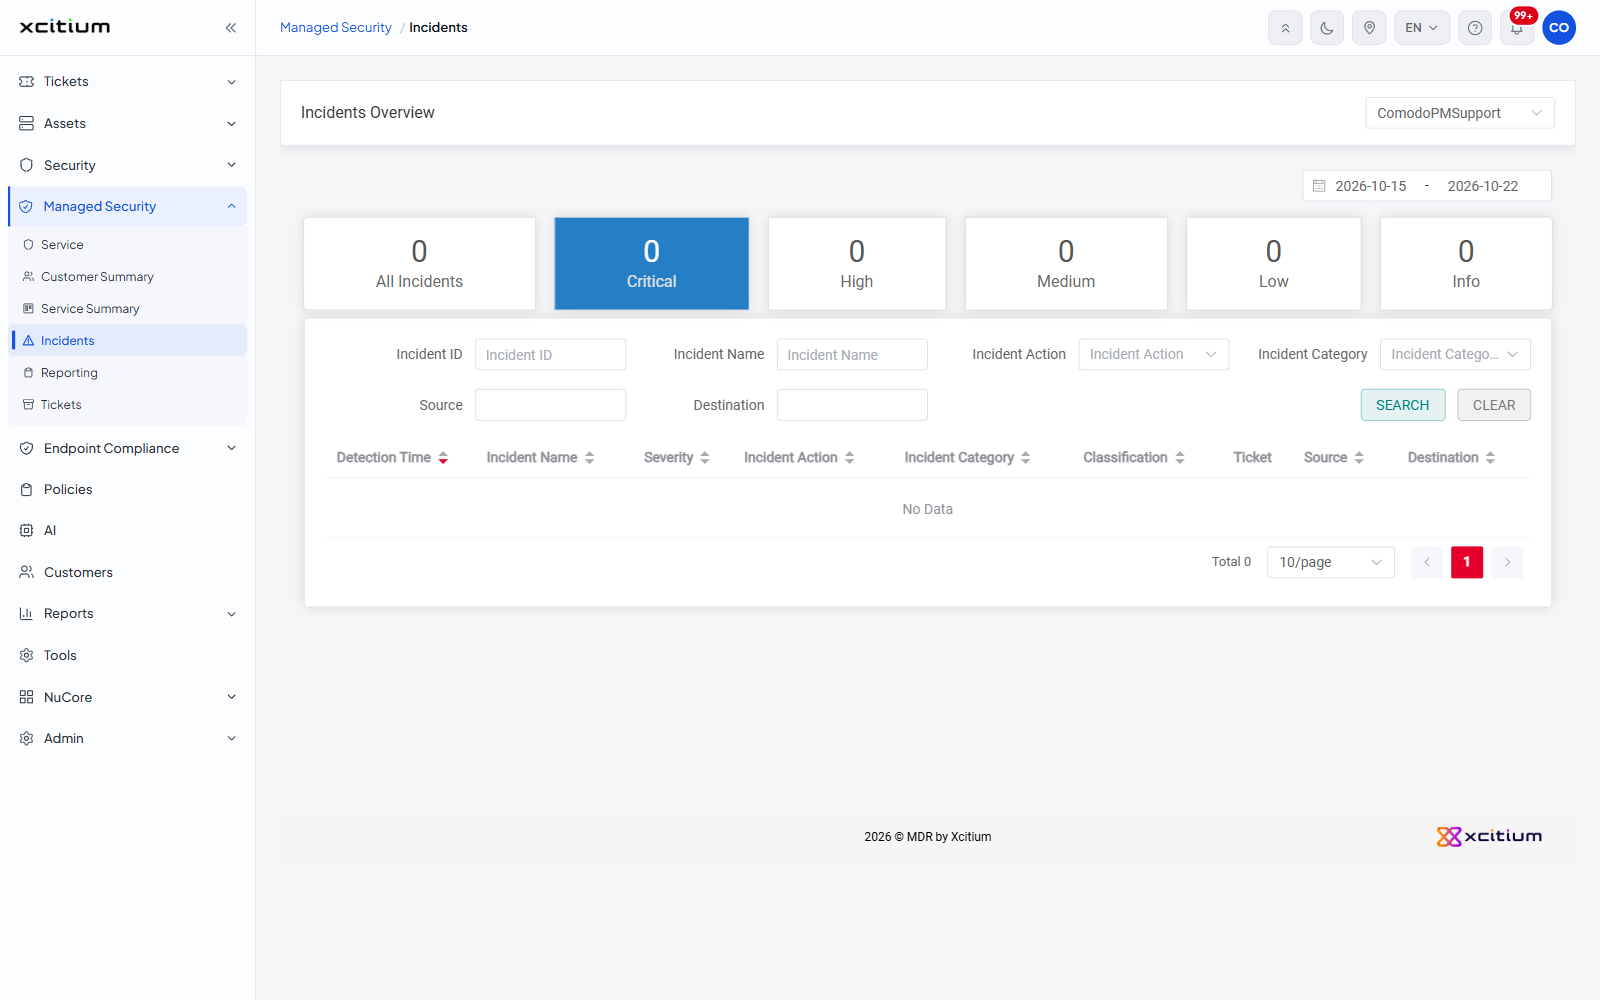
Search panel
The search panel sits between the tiles and the list.
| Field | Control | Default | Description |
| Incident ID | Text box, placeholder 'Incident ID' | Empty | Search for one incident by its identifier. |
| Incident Name | Text box, placeholder 'Incident Name' | Empty | Search by the name of the incident. |
| Incident Action | Drop-down, placeholder 'Incident Action' | Empty | What was done about the incident. Options: 'All', 'Notify', 'Record'. |
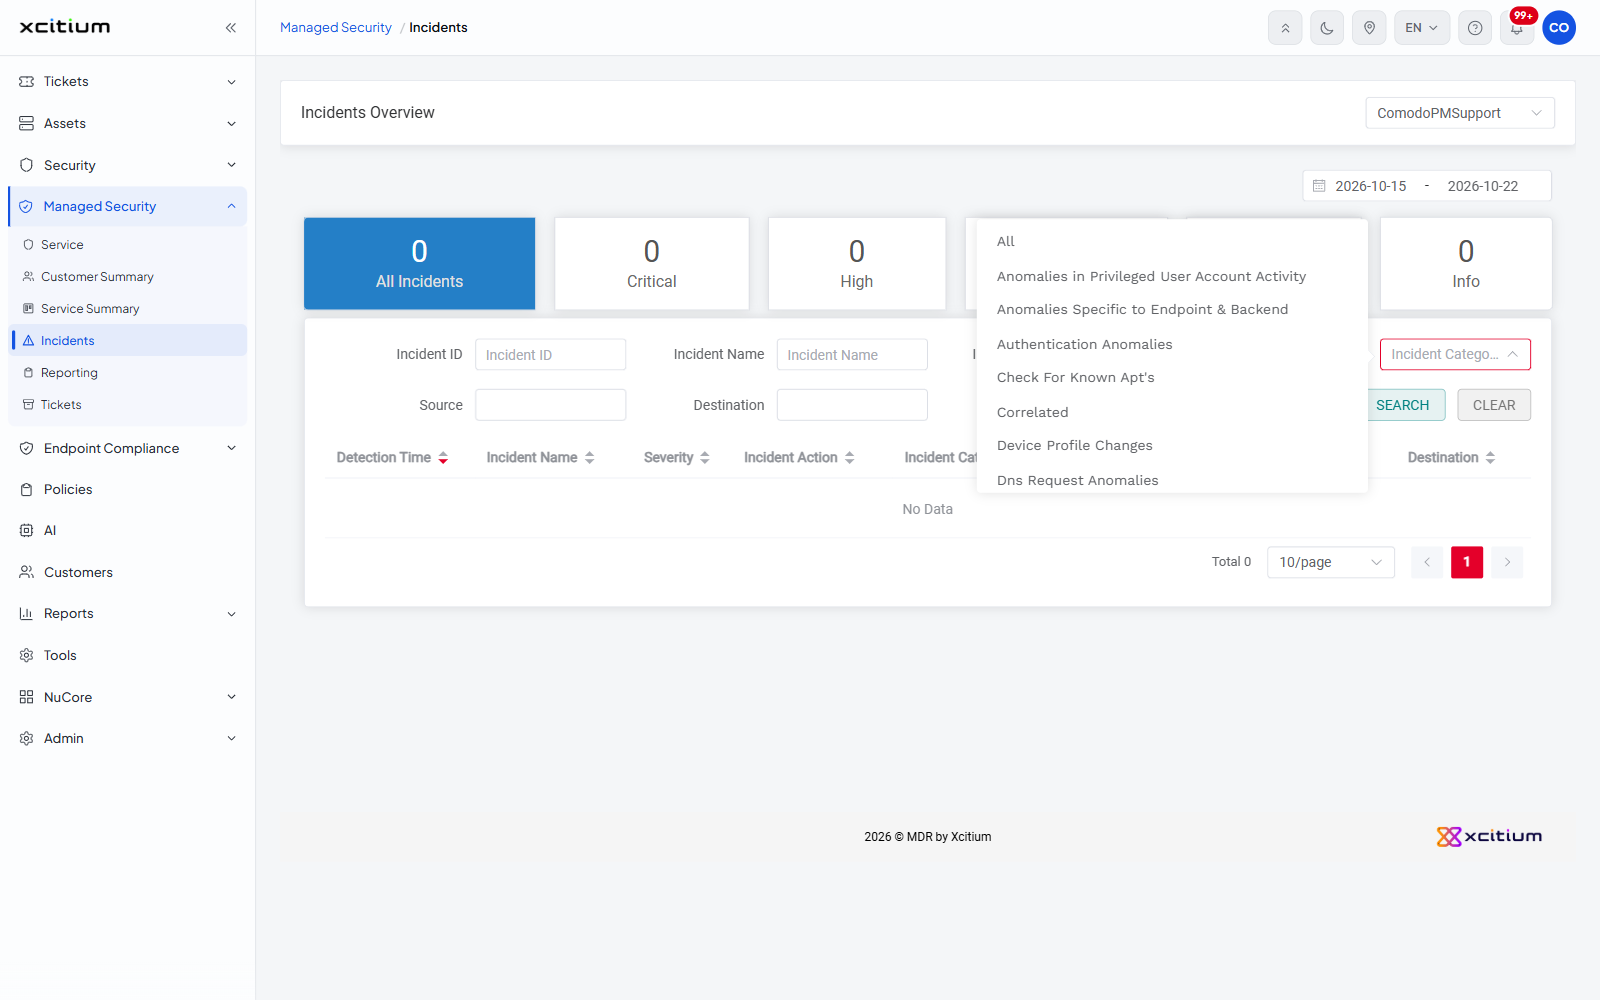
| Incident Category | Drop-down, placeholder 'Incident Category' | Empty | The category the incident falls into. The options are listed below. |
| Source | Text box | Empty | Search by the source of the incident. |
| Destination | Text box | Empty | Search by the destination of the incident. |
| Button | Description |
| SEARCH | Runs the search and re-draws the list. |
| CLEAR | Empties every search field and puts the list back to the full queue. |
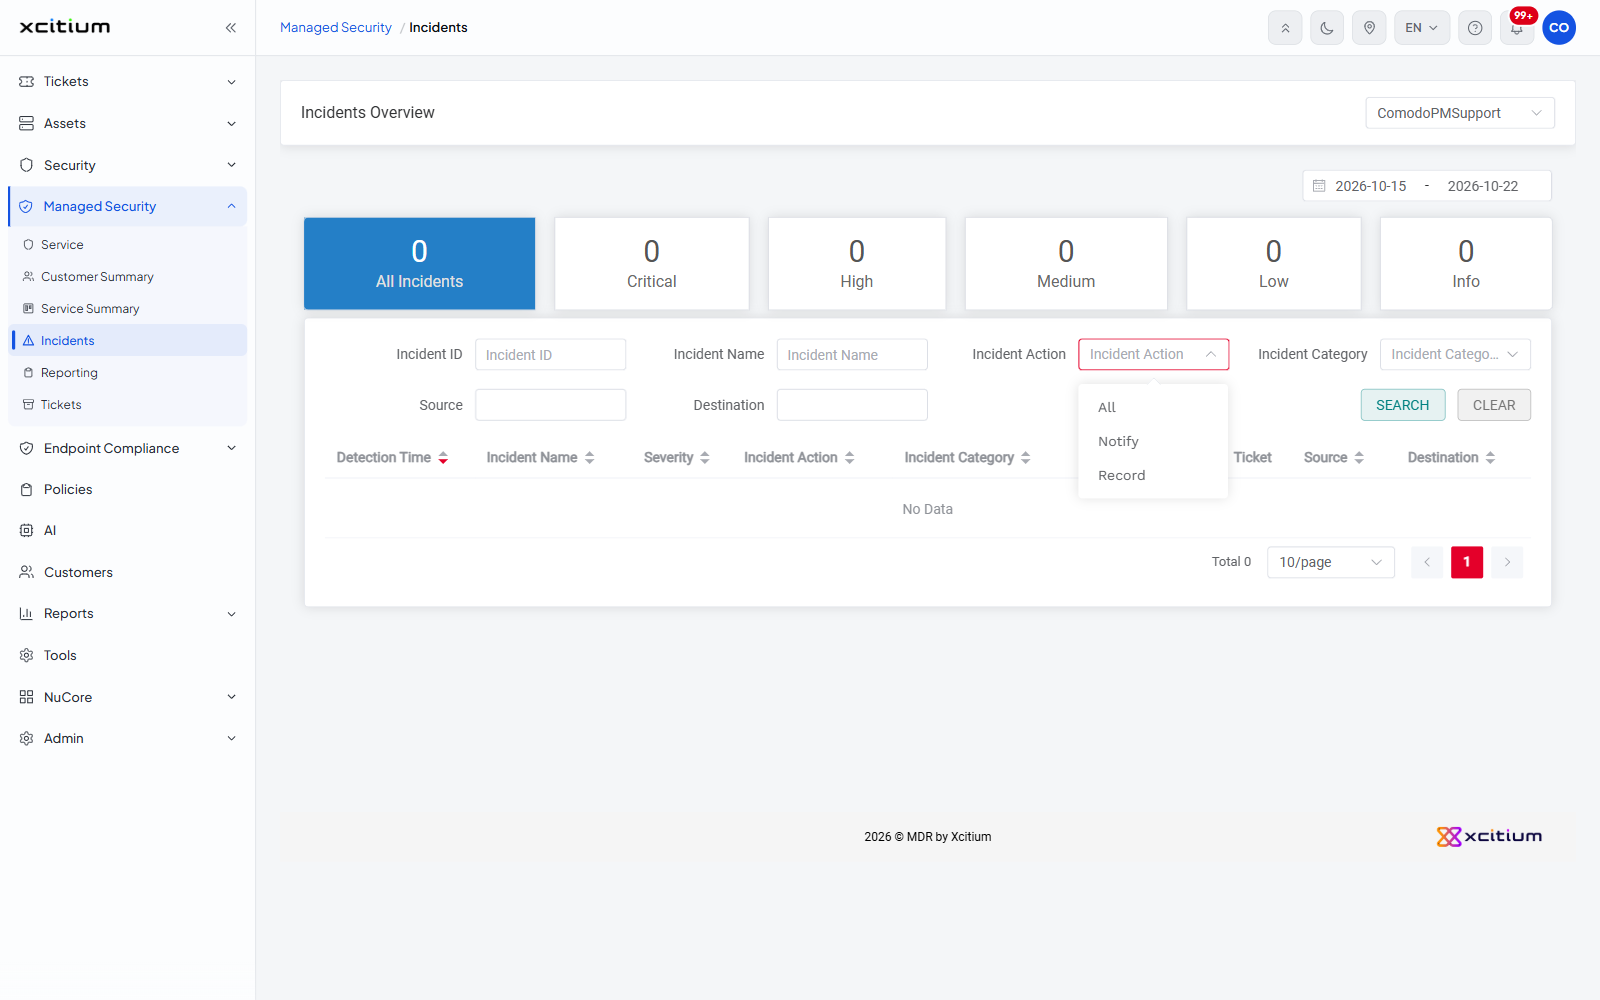
'Incident Category' options
- All
- Anomalies in Privileged User Account Activity
- Anomalies Specific to Endpoint & Backend
- Authentication Anomalies
- Check For Known Apt's
- Correlated
- Device Profile Changes
- DNS Request Anomalies
- Endpoint - Blocked
- Endpoint - Contained
- Endpoint - Detection
- Endpoint - Removed
- Endpoint - Suspicious Defenseplus Event
- Endpoint - Suspicious File Operation
- Endpoint - Suspicious Network Activity
- Endpoint - Suspicious Process Activity
- Endpoint - Suspicious Registry Operation
- Endpoint - Quarantined
- Geographical Irregularities
- Malware Activity
- Manual
- Scheduled Query
- Signs of Dos/DDOS Activity
- Suspicious Malicious Activity
- Uncategorized
- Unpatched or Vulnerable Systems or Applications
- Unusual Network Traffic
- Web Traffic Anomalies
Column descriptions
Columns that carry a sort control in the heading can be sorted.
| Column | Description |
| Detection Time | When the incident was detected. Sortable. |
| Incident Name | The name of the incident. Sortable. |
| Severity | The severity the incident was given. Sortable. |
| Incident Action | What was done about the incident, either 'Notify' or 'Record'. Sortable. |
| Incident Category | The category the incident falls into. Sortable. |
| Classification | How the incident was classified. Sortable. |
| Ticket | The ticket raised for the incident, if any. Not sortable. |
| Source | The source of the incident. Sortable. |
| Destination | The destination of the incident. Sortable. |
Work through a customer’s incidents
- Click 'Managed Security' > 'Service' and scroll to 'Customer Health'.
- Click the three-dot button on the customer's row, then click 'Incidents Overview'.
- Check the date range under the header covers the period you care about.
- Click a severity tile to narrow the list, or leave 'All Incidents' selected.
- To find one incident, type in 'Incident ID' or 'Incident Name', or pick an 'Incident Action' or 'Incident Category', then click 'SEARCH'.
- Click 'CLEAR' to drop the search and go back to the full queue.
- Click a column heading to sort the list.
- Use the customer selector at the top right to move to the next customer.