


Cloud Threat Dashboard
- Click 'Security' > 'Threat Dashboards' > 'Cloud' to open this interface.
The Cloud threat dashboard summarises the security posture of the cloud accounts, container registries and code repositories that have been onboarded. It runs inside an embedded cloud security console, so the toolbar, the widgets and the date control belong to that console rather than to the portal chrome around it.
You can switch between saved dashboards, filter the figures by cloud account or by label, change the period the widgets cover, refresh the data, clone a dashboard, and open the cloud account list to onboard another account.
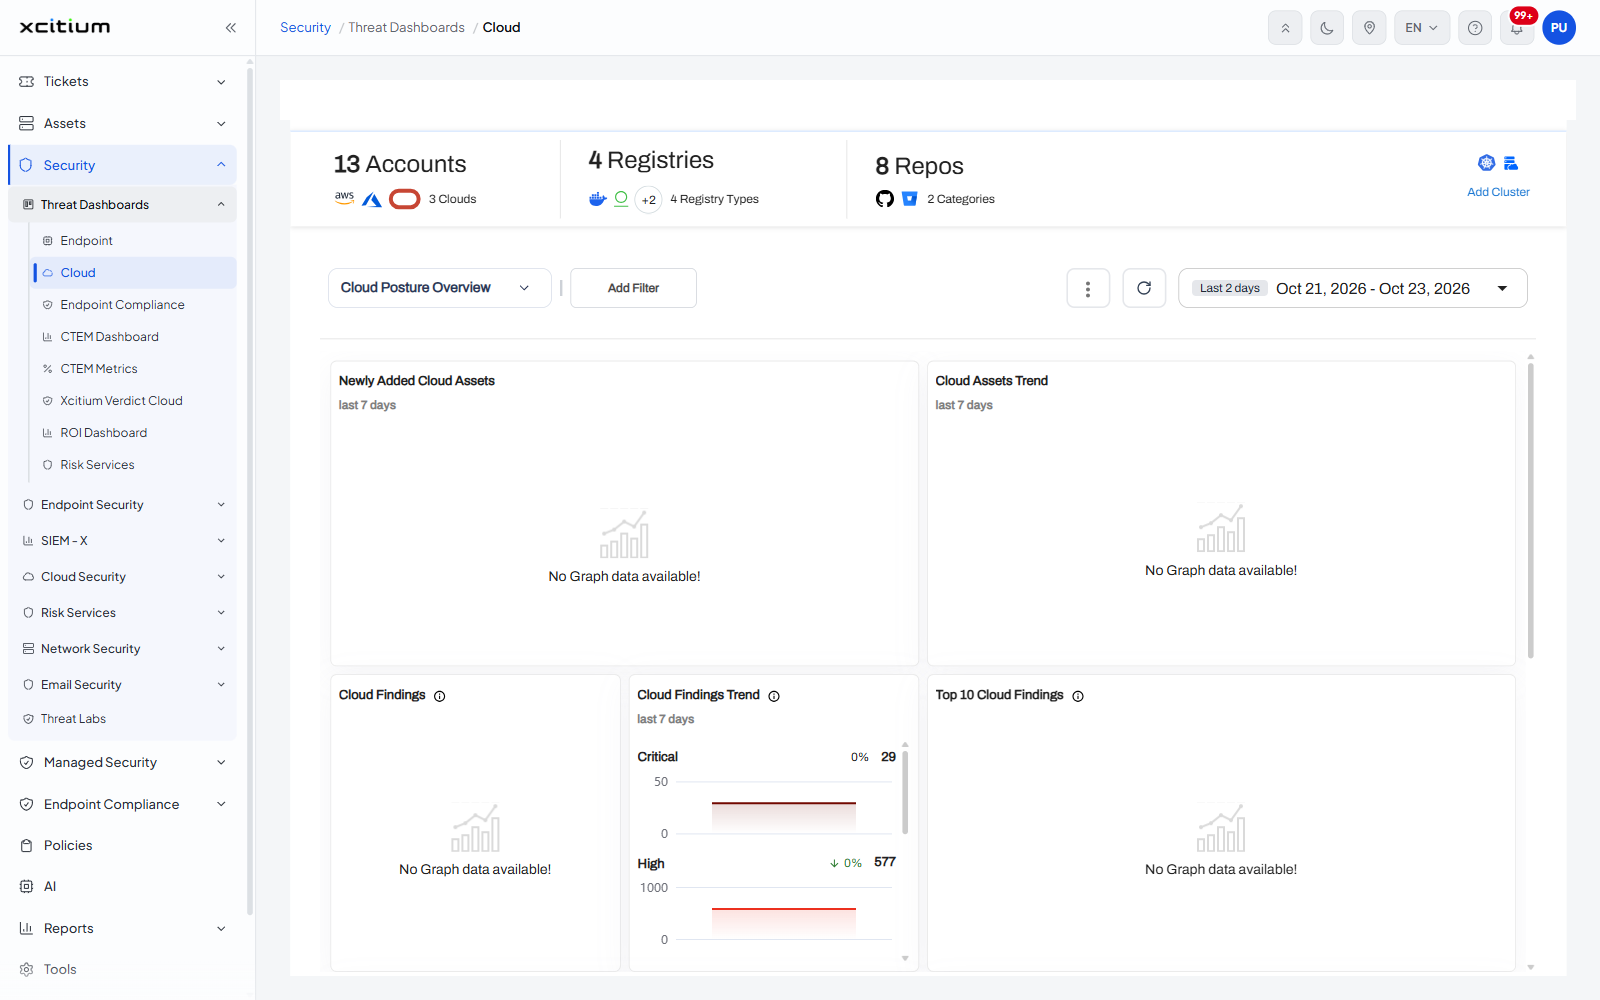
The summary strip
A strip across the top of the panel counts what has been onboarded. Each figure is followed by a row of small provider logos and a second, smaller caption.
| Tile | Description |
| <n> Accounts | The number of cloud accounts onboarded. Below it are the logos of the cloud providers in use and the caption '<n> Clouds'. Clicking this tile opens the cloud account list. |
| <n> Registries | The number of container registries onboarded, with the registry type logos and the caption '<n> Registry Types'. When more logos exist than fit, a '+<n>' chip stands for the rest. |
| <n> Repos | The number of code repositories onboarded, with the source logos and the caption '<n> Categories'. |
| Add Cluster | A link at the right of the strip, under two small icons. It opens the cluster onboarding screen. |
Note: the strip on this console shows counts, not a row of 'Add ...' buttons. The only labelled control on it is 'Add Cluster'; the other tiles are the counts themselves and open the matching list when clicked.
The toolbar
Under the summary strip is the dashboard toolbar. From left to right it holds:
| Control | Description |
| Dashboard selector | A drop-down showing the dashboard on screen, 'Cloud Posture Overview' by default. Opening it lists 'Create a Dashboard' at the top, then every saved dashboard on the account. |
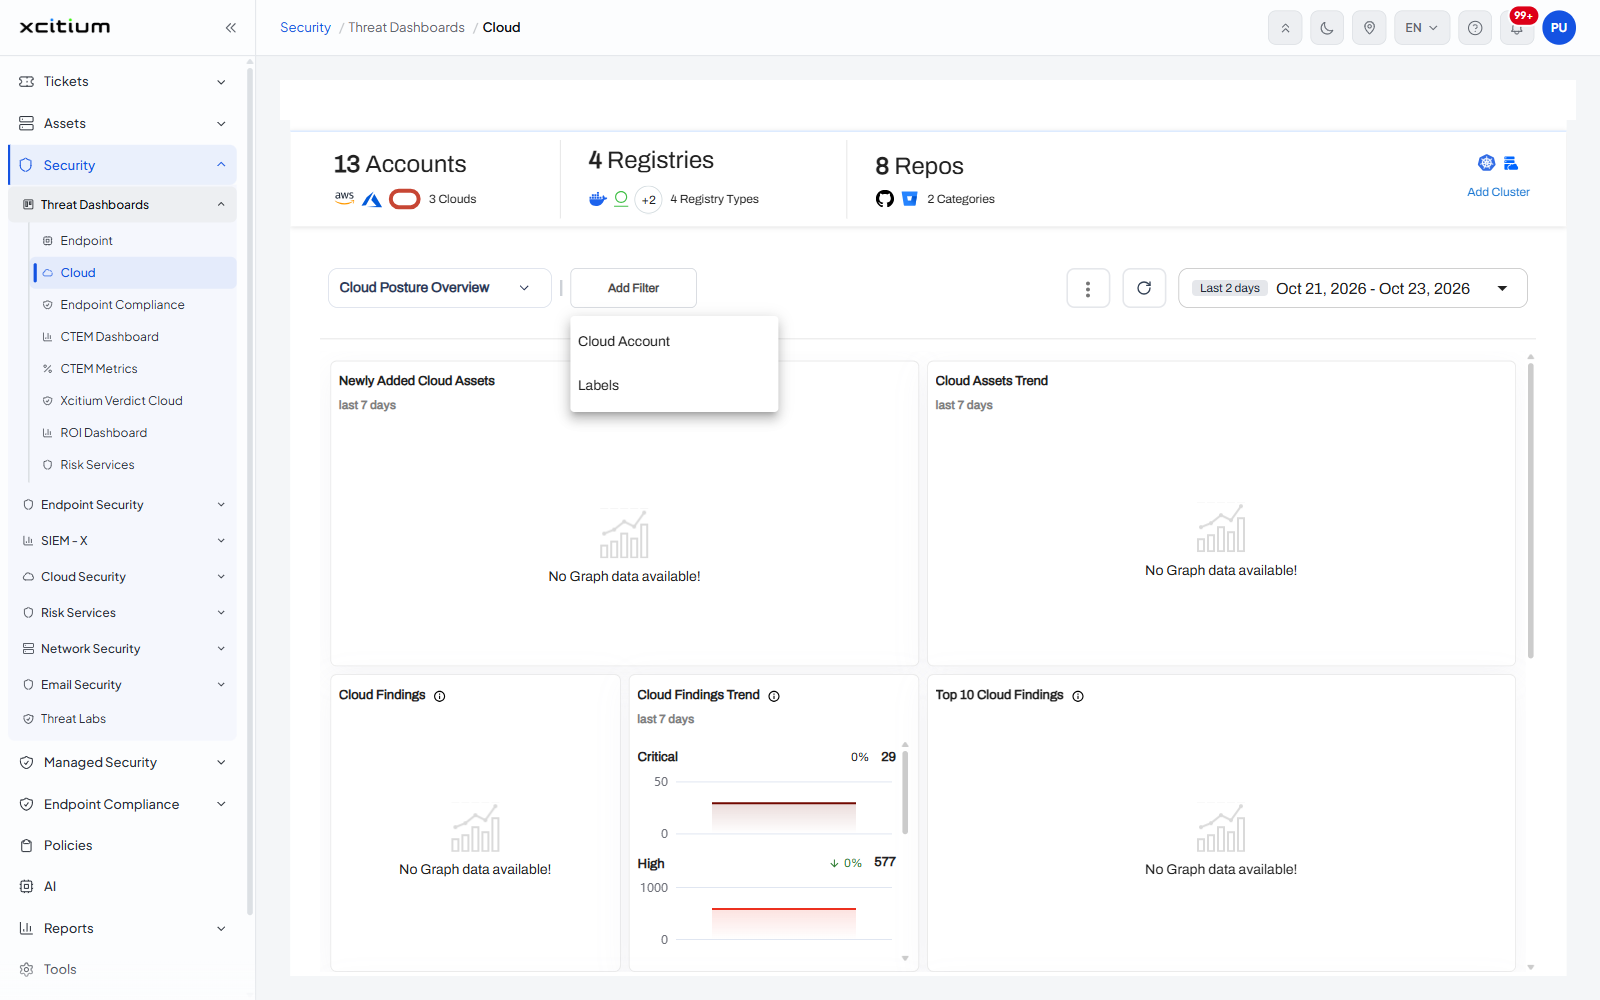
| Add Filter | Adds a filter to every widget at once. The menu offers 'Cloud Account' and 'Labels'. |
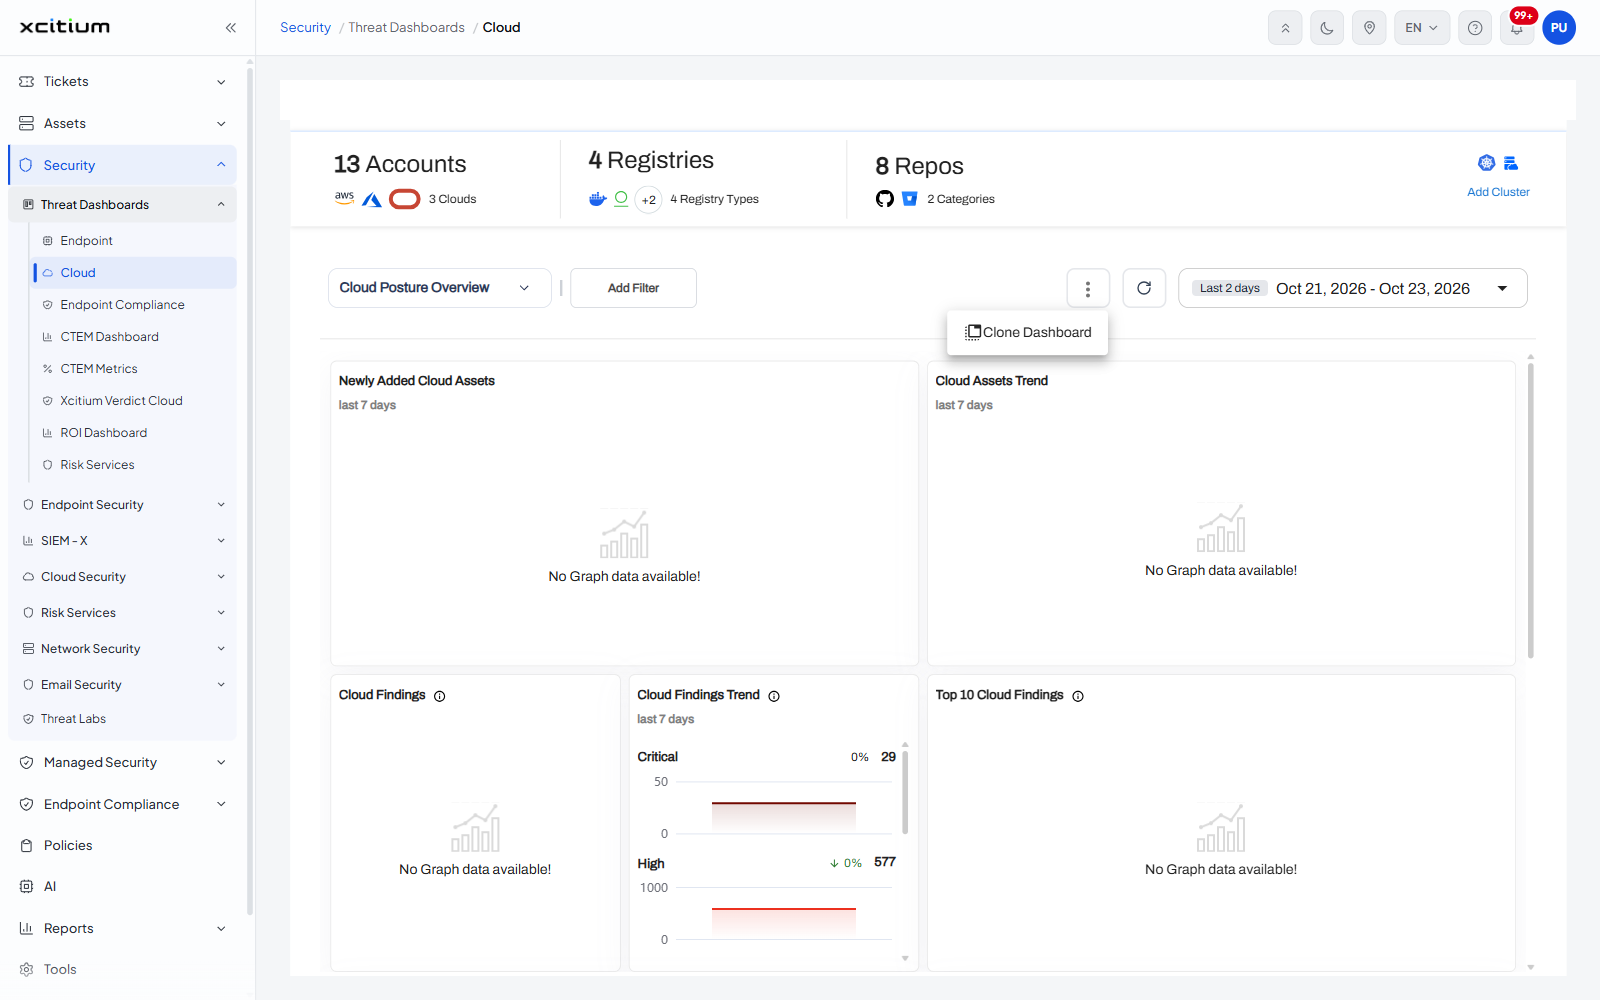
| Action menu (three dots) | Holds one item, 'Clone Dashboard'. |
| Refresh | A circular-arrow icon that reloads the widget data. |
| Date range | A chip naming the period, 'Last 2 days' by default, followed by the dates it resolves to, for example 'Oct 22, 2026 - Oct 23, 2026'. |
Choose a dashboard
- Click the dashboard selector at the left of the toolbar.
- The list opens with 'Create a Dashboard' first, then the saved dashboards in alphabetical order. The one in use is shown at the top of the list as the current value.
- Click the dashboard you want. The canvas below redraws.
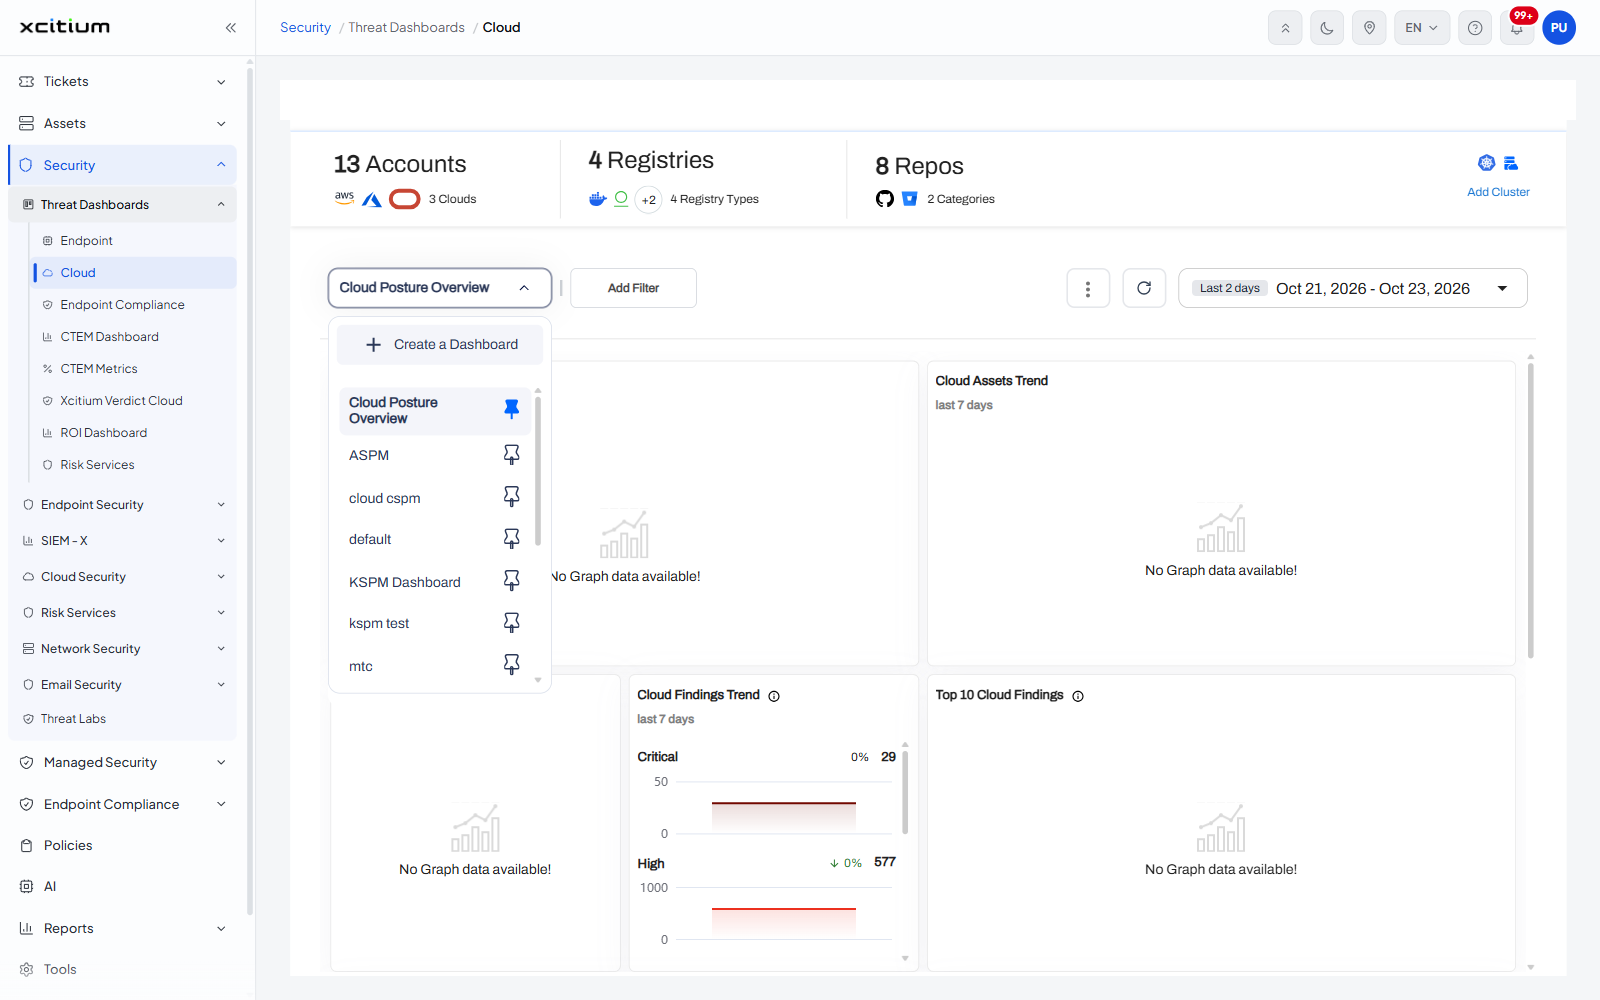
Note: the number of saved dashboards depends on the account. 'Cloud Posture Overview' and 'KSPM Dashboard' are the two supplied ones; the rest are dashboards somebody on the account has created.
Filter the dashboard
- Click 'Add Filter'.
- Choose 'Cloud Account' to restrict the figures to one or more onboarded accounts, or 'Labels' to restrict them to the assets carrying a label.
Clone a dashboard
- Open the dashboard you want to copy.
- Click the three-dot action menu to the right of the toolbar.
- Click 'Clone Dashboard'.
Change the period
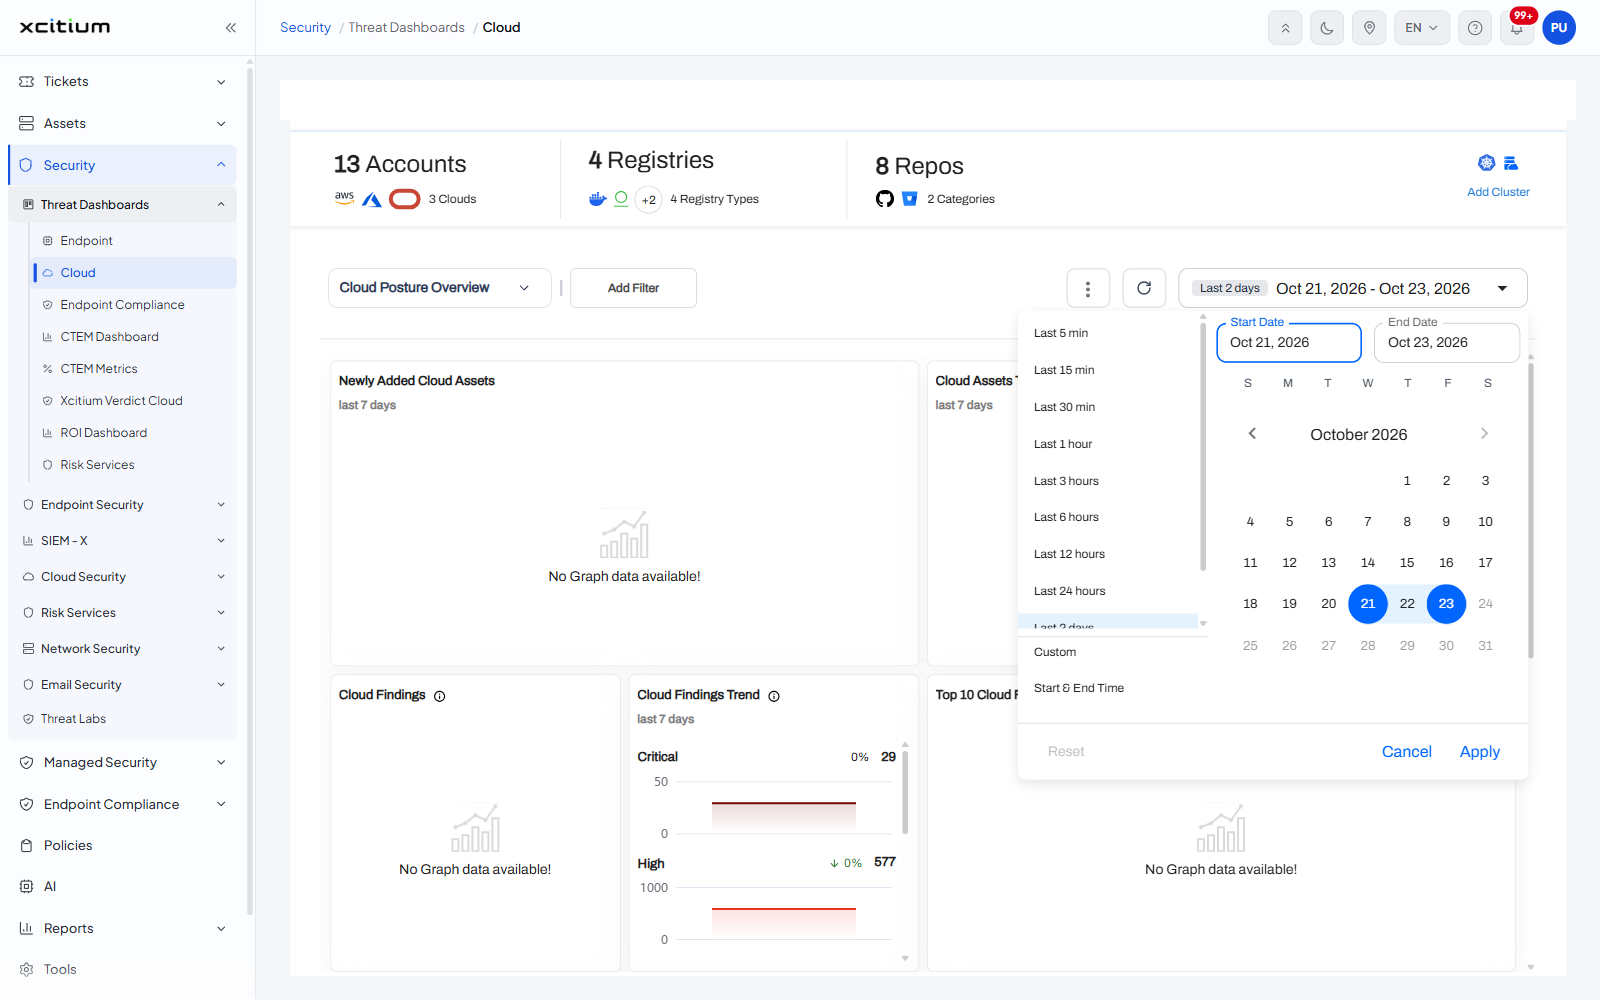
Click the date-range control to open the period picker. The left column holds the presets, the right side holds a start and end date with a month calendar, and three buttons sit along the bottom.
| Field | Options / description |
| Presets | 'Last 5 min', 'Last 15 min', 'Last 30 min', 'Last 1 hour', 'Last 3 hours', 'Last 6 hours', 'Last 12 hours', 'Last 24 hours', 'Last 2 days' (the default), 'Last 7 days', 'Custom', 'Start & End Time'. |
| Start Date | A text box with its own label, filled in by the calendar or typed. |
| End Date | A text box with its own label, filled in by the calendar or typed. |
| Calendar | A single month grid with the weekday initials S M T W T F S across the top. |
| Reset | Returns the picker to its starting values. |
| Cancel | Closes the picker and leaves the period unchanged. |
| Apply | Applies the chosen period to the widgets. |
The widgets
The canvas below the toolbar holds the widgets of the chosen dashboard. On 'Cloud Posture Overview' they are, in order:
| Widget | What it shows |
| Newly Added Cloud Assets | Assets discovered in the period named under the title, 'last 7 days'. |
| Cloud Assets Trend | The asset count over 'last 7 days'. |
| Cloud Findings | The findings raised against the cloud accounts. |
| Cloud Findings Trend | One row per severity - 'Critical', 'High', 'Medium', 'Low', 'Informational' - each with the change as a percentage, the total count, and a bar drawn against a fixed scale. Covers 'last 7 days'. |
| Top 10 Cloud Findings | The ten findings raised most often. |
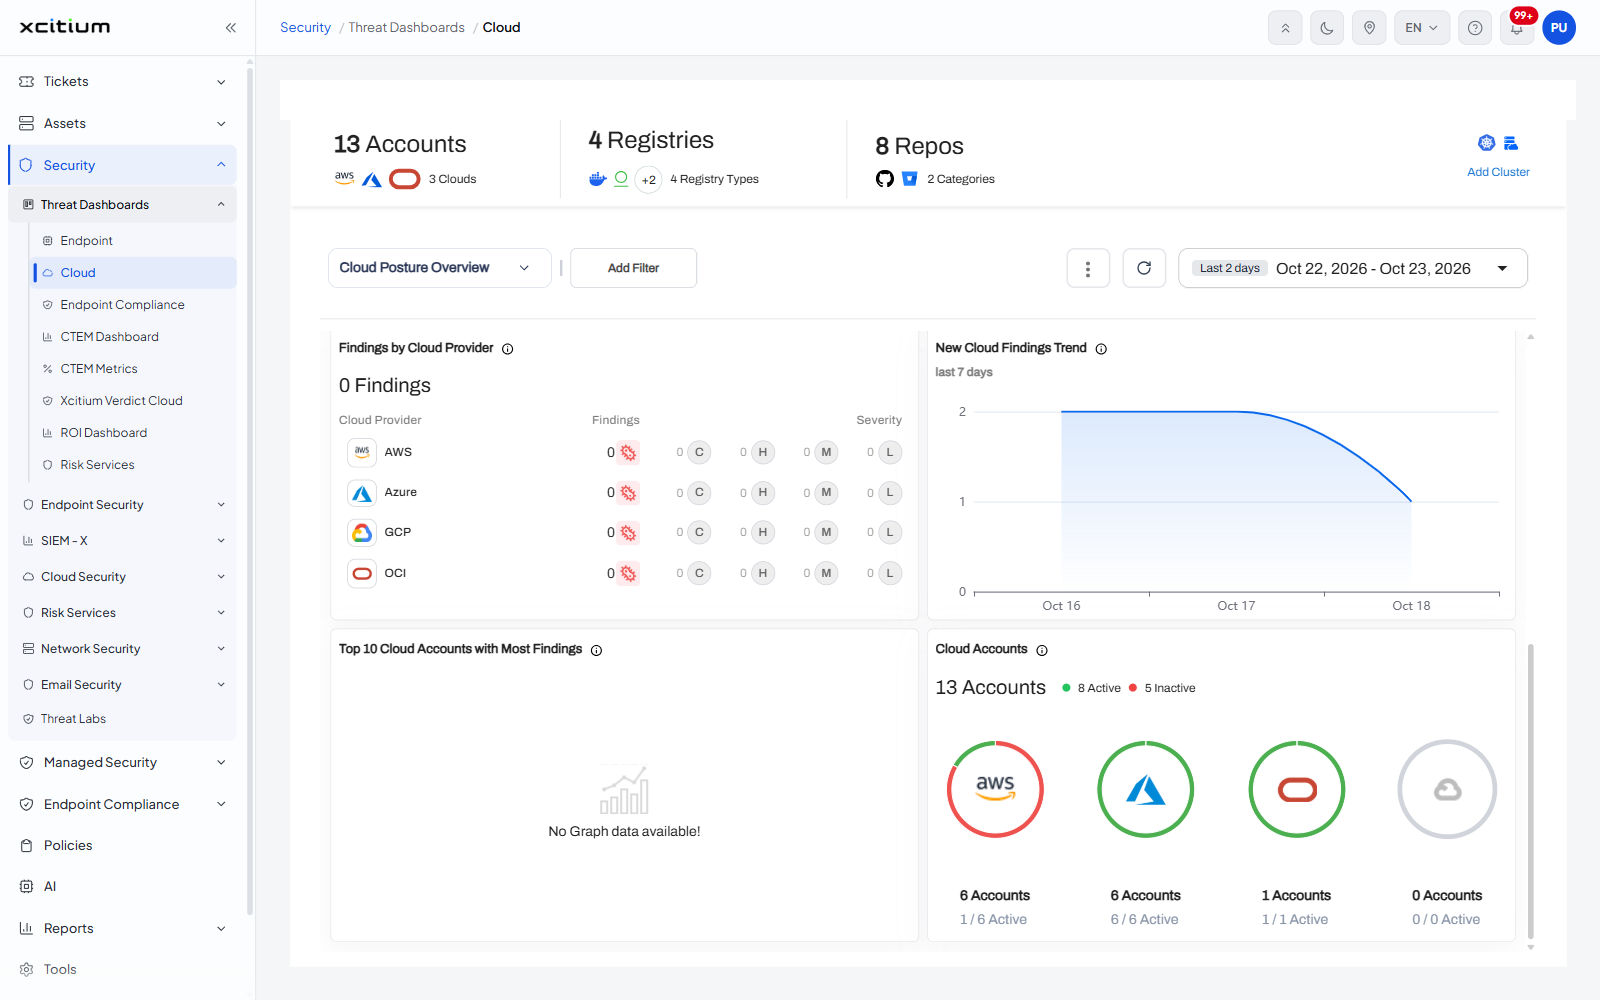
| Findings by Cloud Provider | A table of 'Cloud Provider', 'Findings' and 'Severity', with a row for 'AWS', 'Azure', 'GCP' and 'OCI'. The severity cell holds four counters labelled C, H, M and L. A total, for example '0 Findings', sits above the table. |
| New Cloud Findings Trend | A line chart of new findings, 'Assets' against 'Date', over 'last 7 days'. |
| Top 10 Cloud Accounts with Most Findings | The ten accounts carrying the most findings. |
| Cloud Accounts | The account total with an 'Active' and an 'Inactive' legend, then one ring per provider showing '<n> Accounts' and '<n> / <n> Active'. |
Open the cloud account list
- Click the accounts tile at the left of the summary strip.
- The embedded console opens its cloud account list, where accounts can be searched, filtered and onboarded.