


CTEM Dashboard
- Click 'Security' > 'Threat Dashboards' > 'CTEM Dashboard' to open this interface.
The continuous threat exposure management dashboard shows the vulnerability and compliance position of the assets the CTEM scanner has seen. It runs inside an embedded console, and the canvas itself is a saved dashboard view - picking a different view replaces every chart on the page.
You can choose which dashboard view to display, move between the tabs inside a view, filter the view, refresh it, look up a single CVE, and read the alerts the scanner has raised.
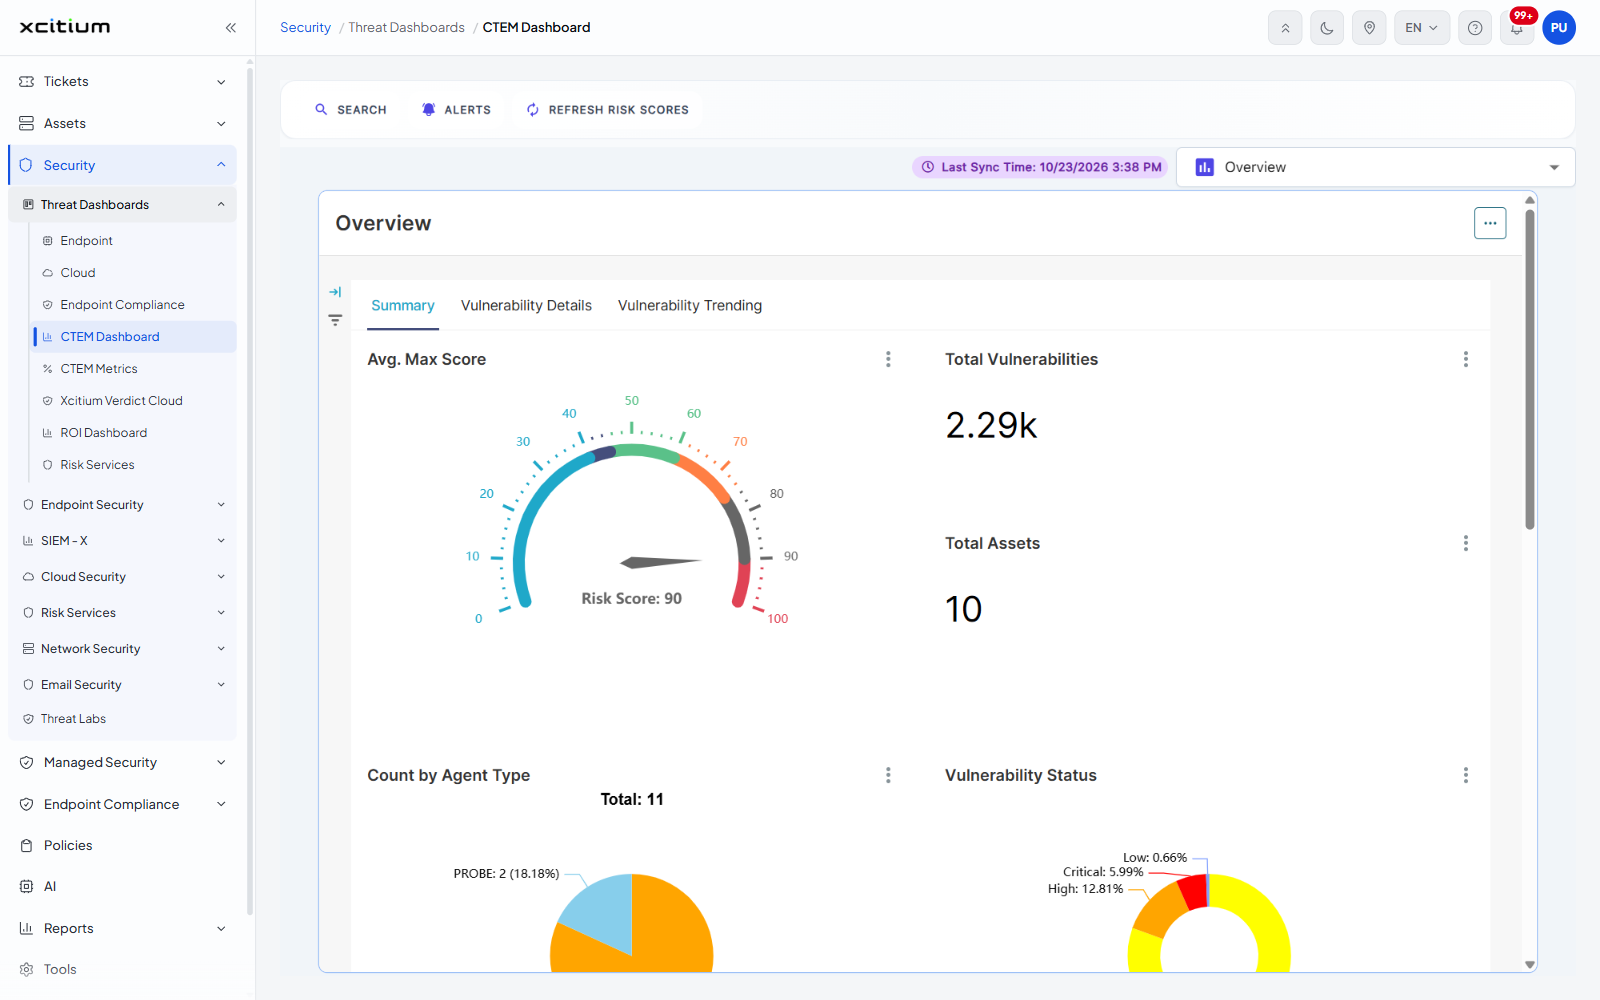
The toolbar
A toolbar sits above the dashboard with three controls, each an icon and a label in capitals.
| Control | Description |
| SEARCH | Opens a 'Search CVE' box so you can look up a single vulnerability. |
| ALERTS | Opens the 'Alerts' panel on the right of the window. |
| REFRESH RISK SCORES | Recalculates the risk scores. This control acts at once and has no confirmation step. |
Below the toolbar, on the right, are a 'Last Sync Time:' chip with the date and time of the last synchronisation and the dashboard view selector.
Choose a dashboard view
- Click the view selector at the top right, which shows the view currently on screen.
- The list opens. Each entry has a chart icon, the view name, and a category in small capitals underneath.
- Click the view you want. The canvas redraws under the view's own name.
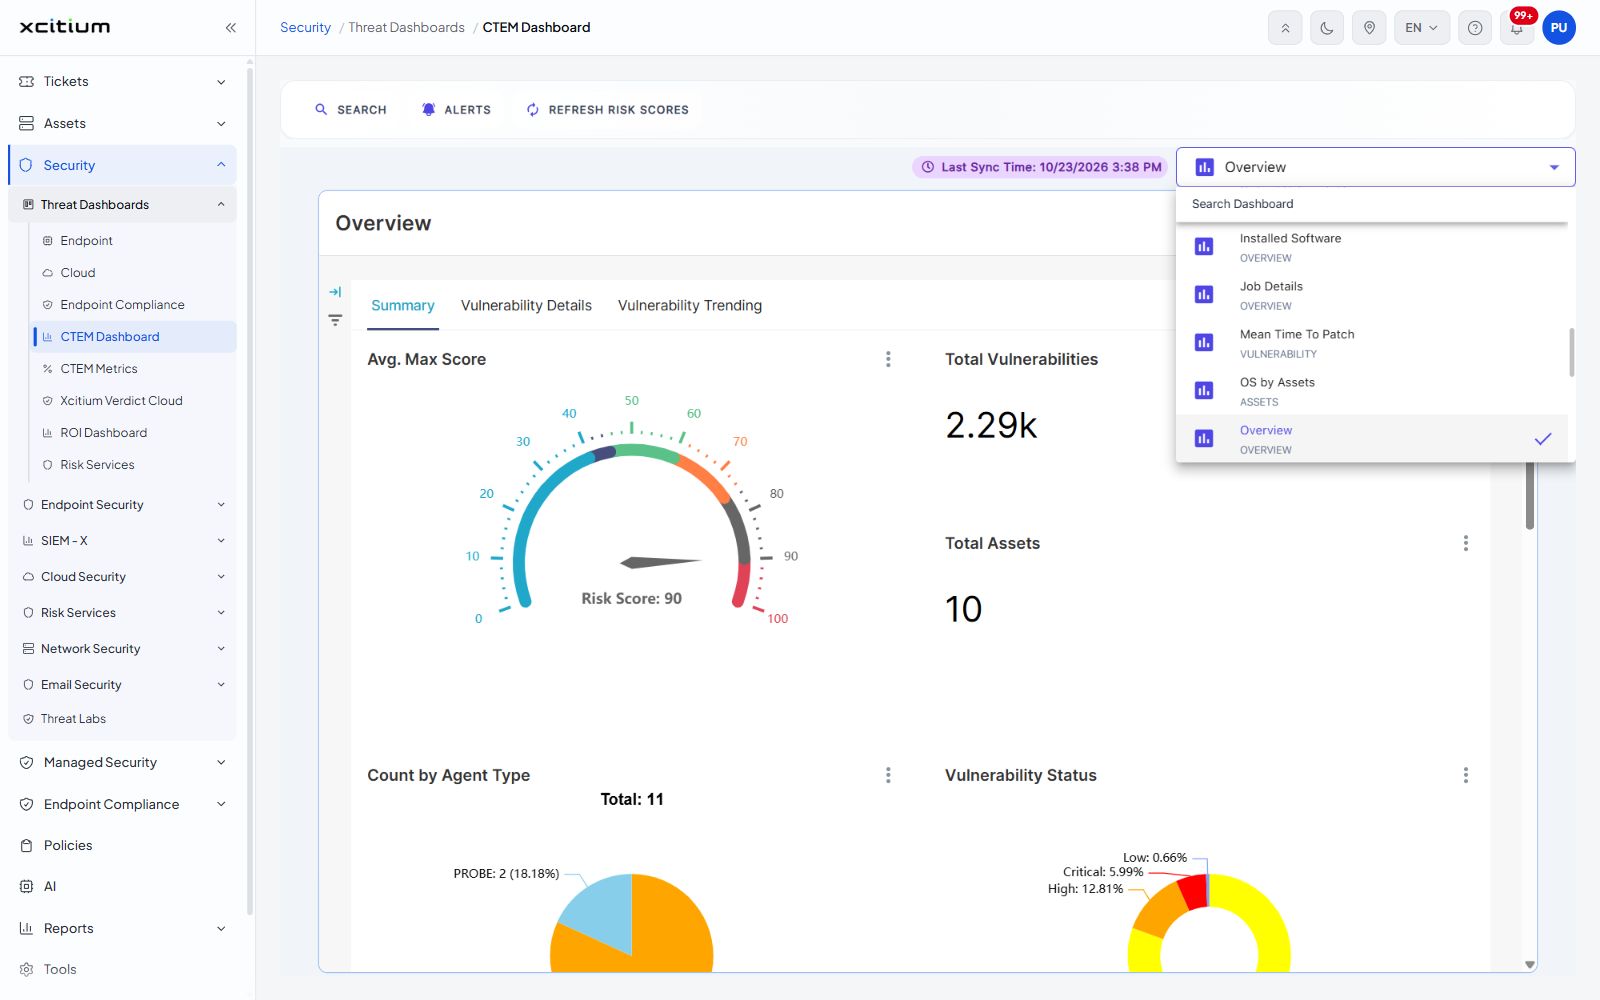
The views supplied, with their categories:
| Category | Views |
| OVERVIEW | 'Overview', 'Agent Details', 'Installed Software', 'Job Details', 'Schedulers' |
| ASSETS | 'Asset Details', 'OS by Assets', 'Port Details' |
| VULNERABILITY | 'CISA Vulnerabilities', 'Critical Vulnerabilities', 'Mean Time To Patch', 'Patch Management', 'Pending OS Patches', 'Remediated Count', 'Remediation Plan', 'Risk Score Card', 'Security Report Card', 'Vulnerability Summary' |
| COMPLIANCE | 'Compliance Standard PCI DSS', 'Compliance Standards CIS', 'Compliance Standards Cyber Essentials', 'Compliance Standards Essential Eight', 'Compliance Standards GDPR', 'Compliance Standards GPG 13', 'Compliance Standards HIPAA', 'Compliance Standards ISO 27002', 'Compliance Standards NIST 800 171', 'Compliance Standards NIST 800 53', 'Compliance Standards NIST CSF 2.0' |
The 'Overview' view
'Overview' is the view the dashboard opens on. Its name is repeated as a heading on the canvas, with a three-dot menu at the right of that heading. Inside the view are three tabs.
| Tab | What it holds |
| Summary | 'Avg. Max Score' (a gauge from 0 to 100 captioned 'Risk Score: <n>'), 'Total Vulnerabilities', 'Total Assets', 'Count by Agent Type' (a pie captioned 'Total: <n>'), 'Vulnerability Status' (a ring broken down by severity), 'Asset Type', 'Top 5 OS Breakdown', 'Top 5 Assets By Vulnerabilities' and 'Top 5 Asset Risk Rating'. |
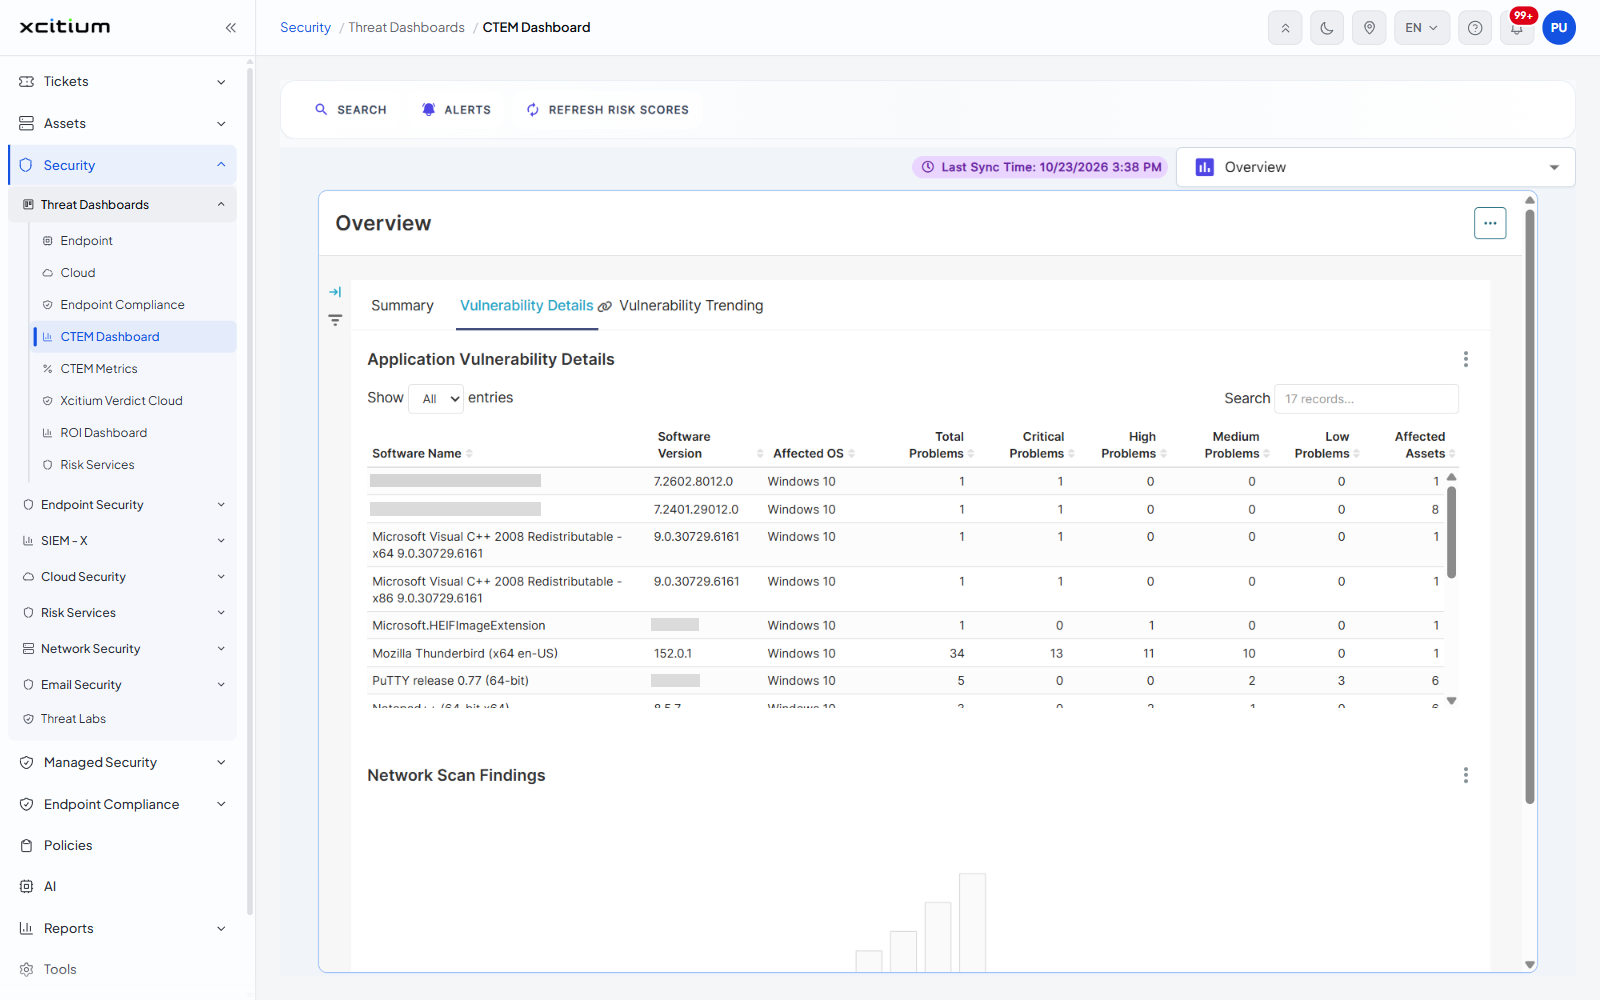
| Vulnerability Details | 'Application Vulnerability Details', a table with its own 'Show <n> entries' selector and 'Search' box. |
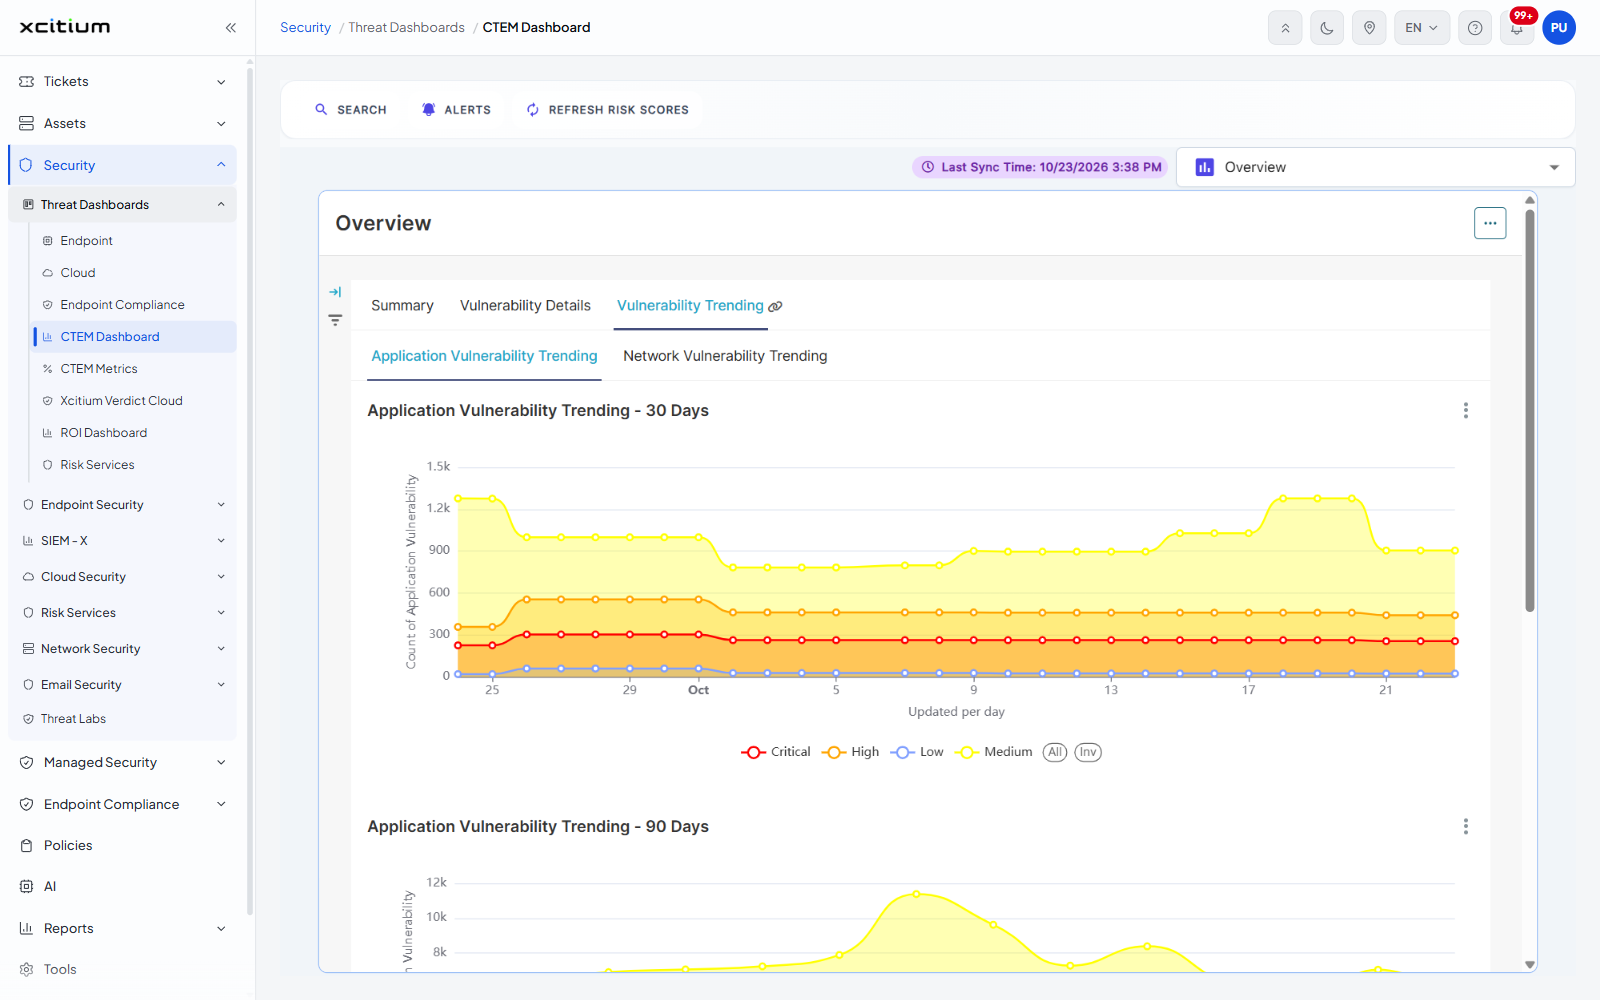
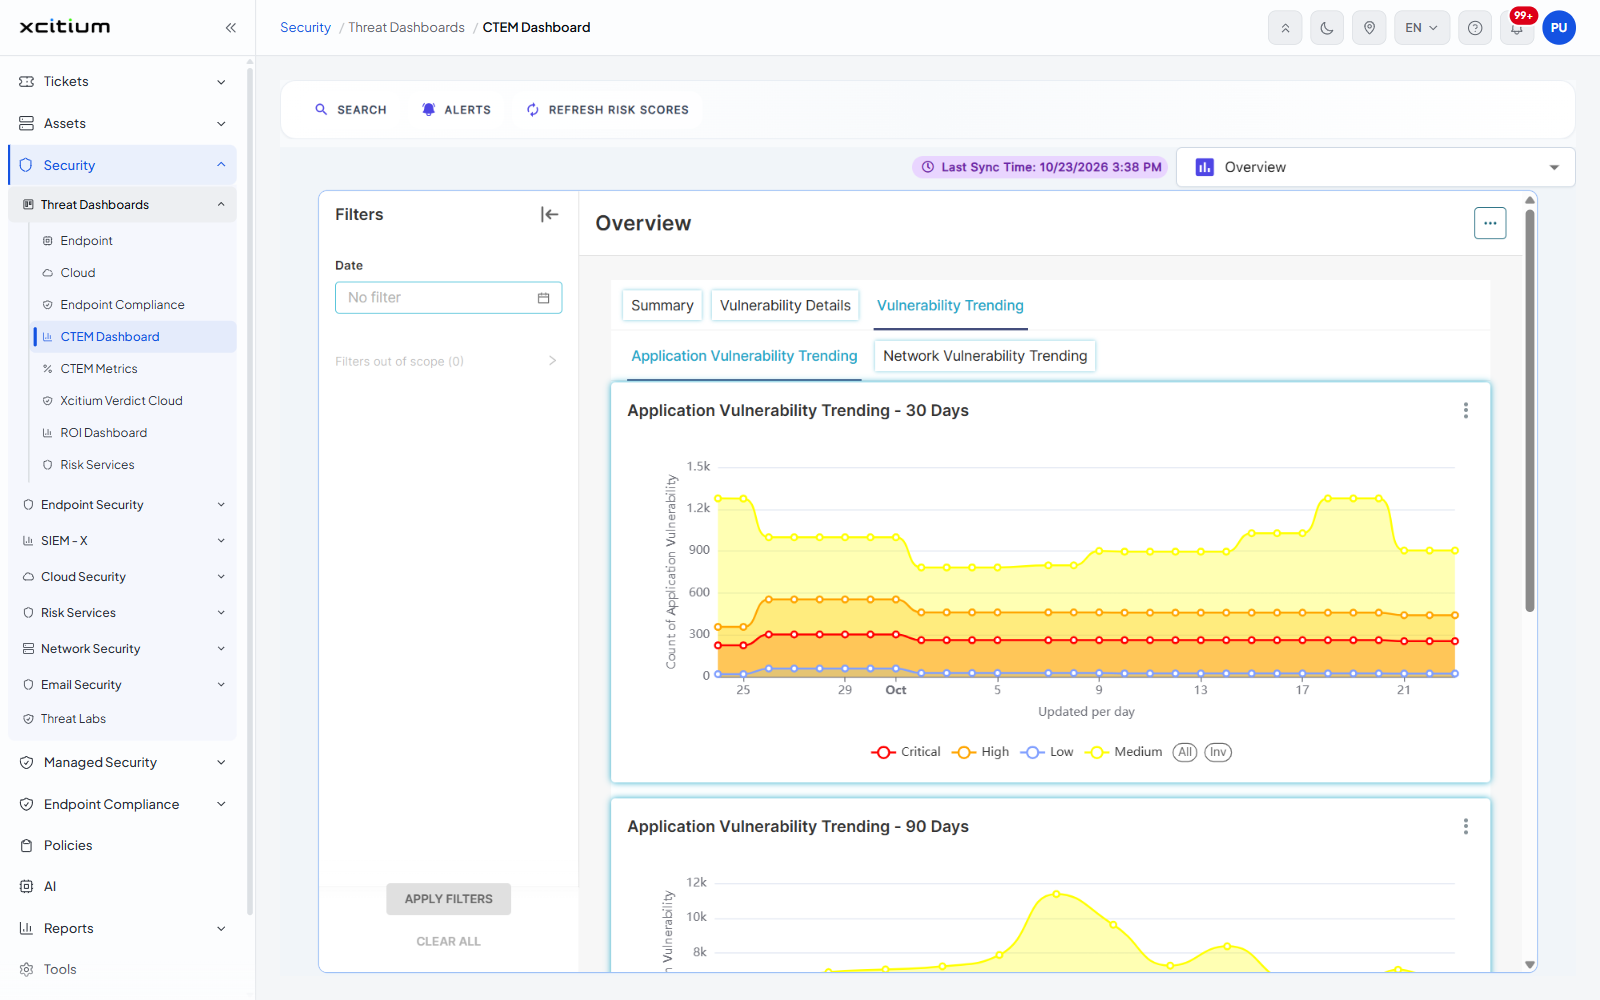
| Vulnerability Trending | Two sub-tabs, 'Application Vulnerability Trending' and 'Network Vulnerability Trending'. The first draws three charts: '- 30 Days', '- 90 Days' and '- 1 year', each plotting 'Count of Application Vulnerability' against time with a Critical / High / Low legend. |
Each widget carries its own three-dot menu in the top right corner.
Columns of 'Application Vulnerability Details'
| Column | Description |
| Software Name | The application the vulnerabilities were found in. |
| Software Version | The version installed. |
| Affected OS | The operating system the finding applies to. |
| Total Problems | All vulnerabilities found for that software version. |
| Critical Problems | How many of them are critical. |
| High Problems | How many are high. |
| Medium Problems | How many are medium. |
| Low Problems | How many are low. |
| Affected Assets | The number of assets carrying that software version. |
Each column heading has a sort control beside it.
Filter the dashboard
- Click the expand arrow on the narrow rail at the left of the canvas.
- The 'Filters' panel slides open. It holds a 'Date' filter showing 'No filter' with a calendar button, and a collapsed section 'Filters out of scope (0)'.
- Set the filter you want and click 'APPLY FILTERS', or click 'CLEAR ALL' to drop every filter.
- Click the collapse arrow at the top of the panel to close it again.
The view's action menu
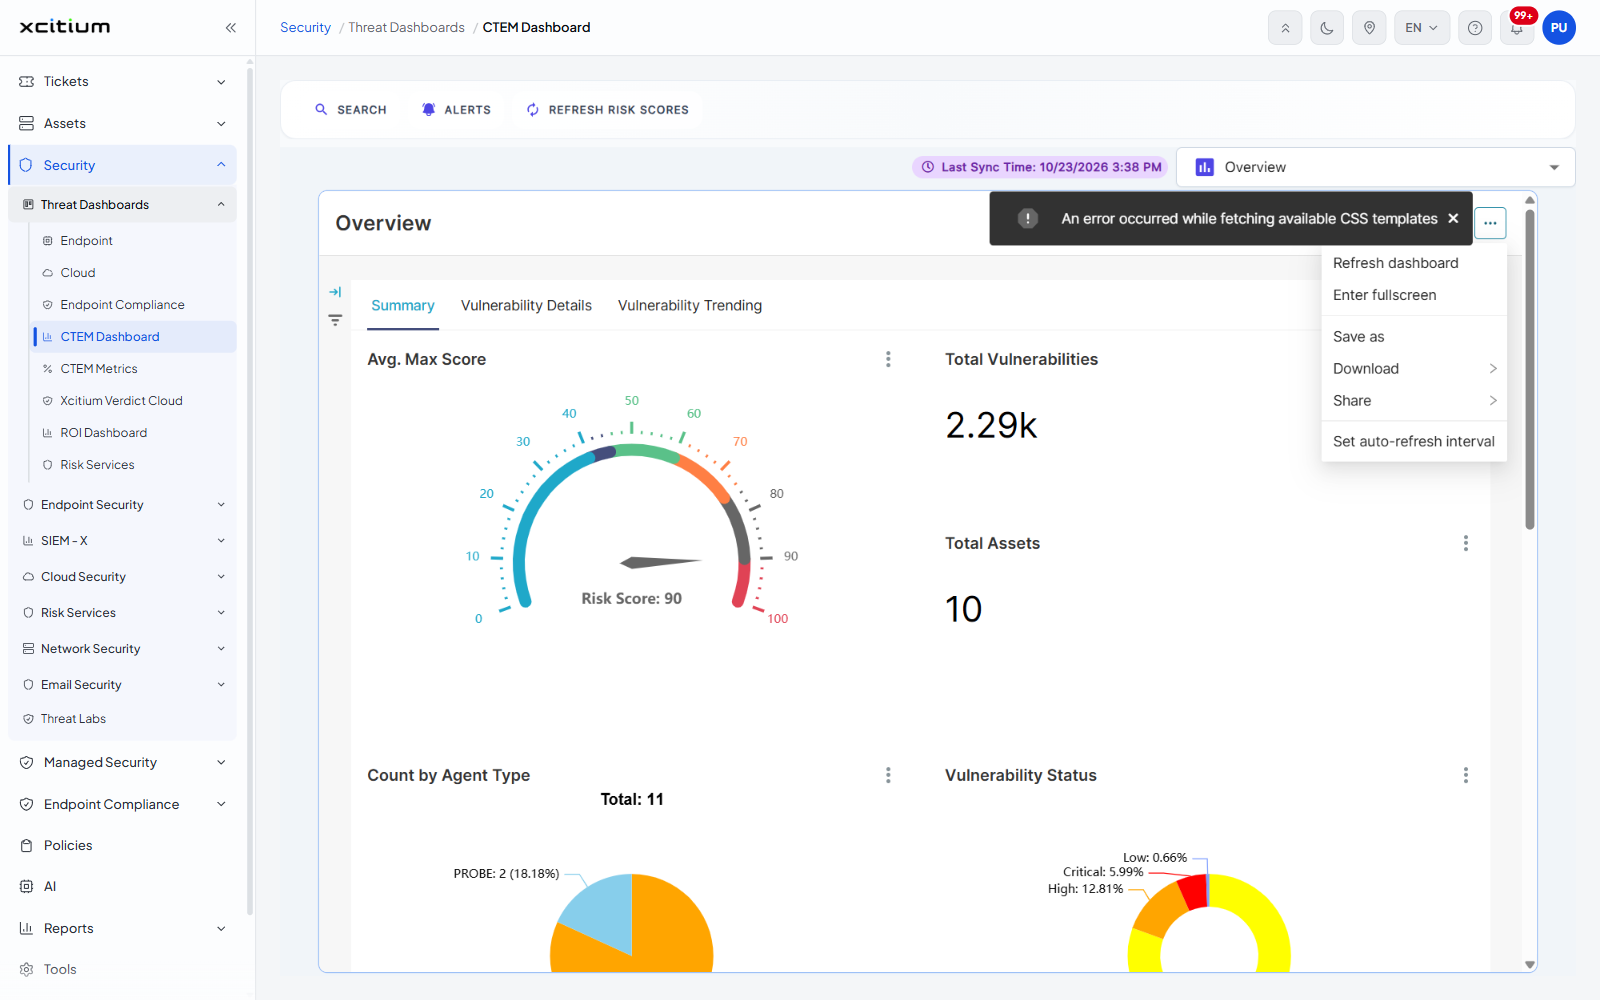
Click the three-dot menu beside the view name to open it. It holds:
- 'Refresh dashboard'
- 'Enter fullscreen'
- 'Save as'
- 'Download'
- 'Share'
- 'Set auto-refresh interval'
Search for a CVE
- Click 'SEARCH' on the toolbar. A 'Search CVE' box appears in the toolbar itself, prefixed 'CVE-' and hinted 'Ex. 2021-21166', with its own 'SEARCH' button.
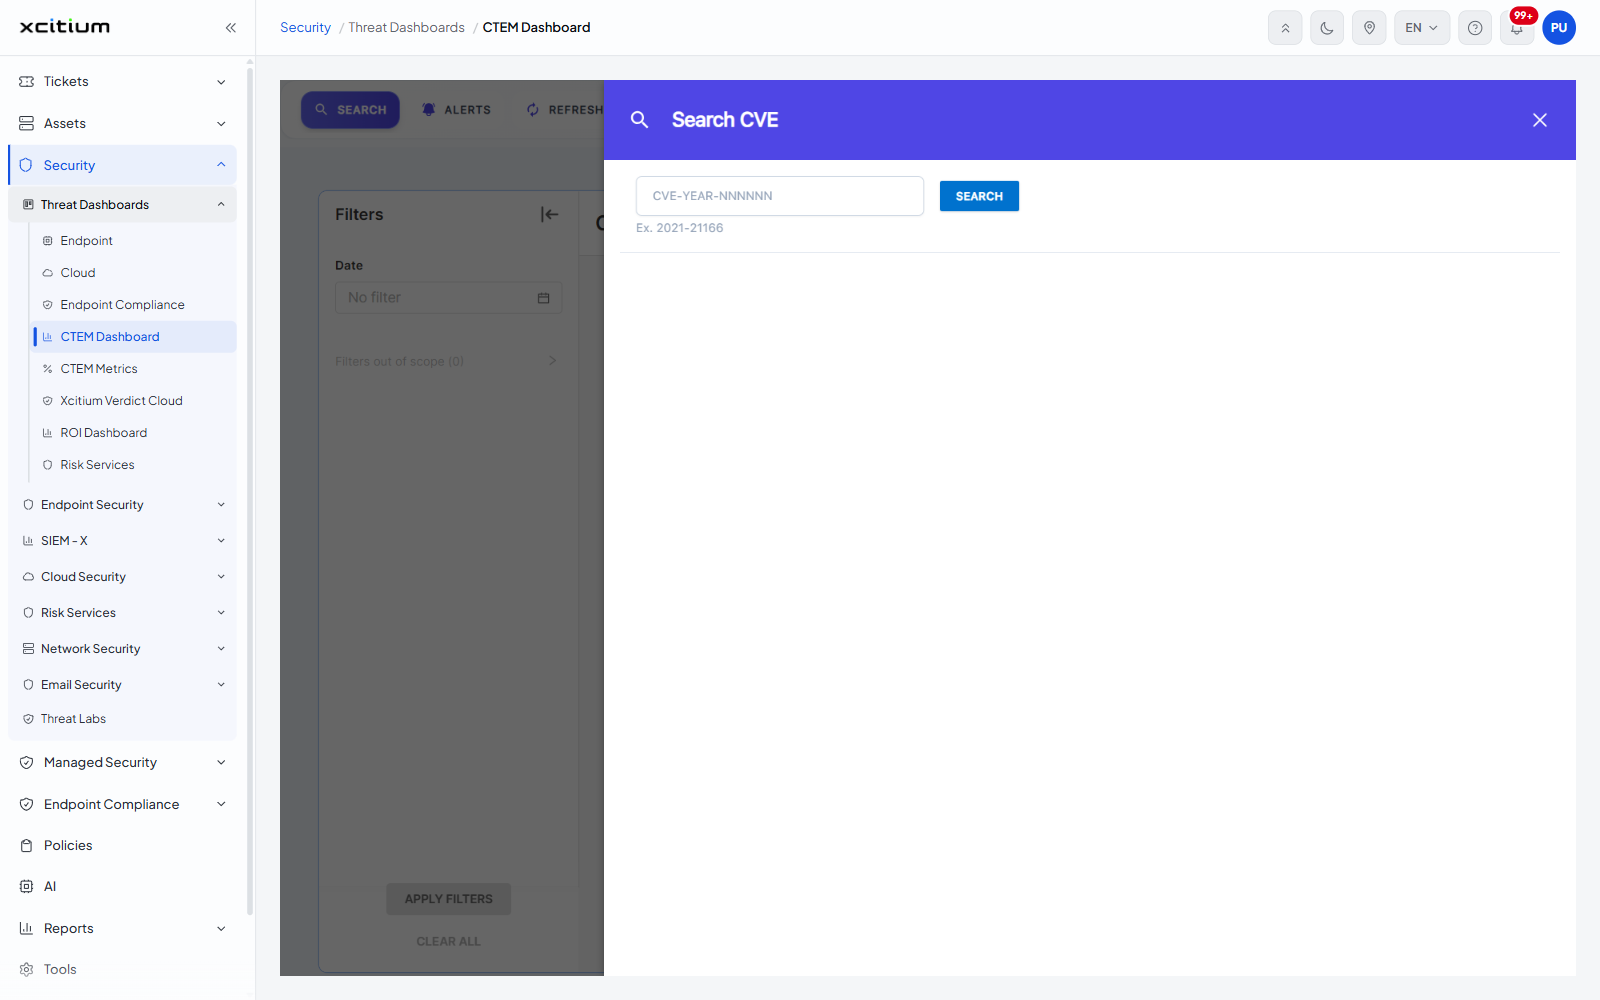
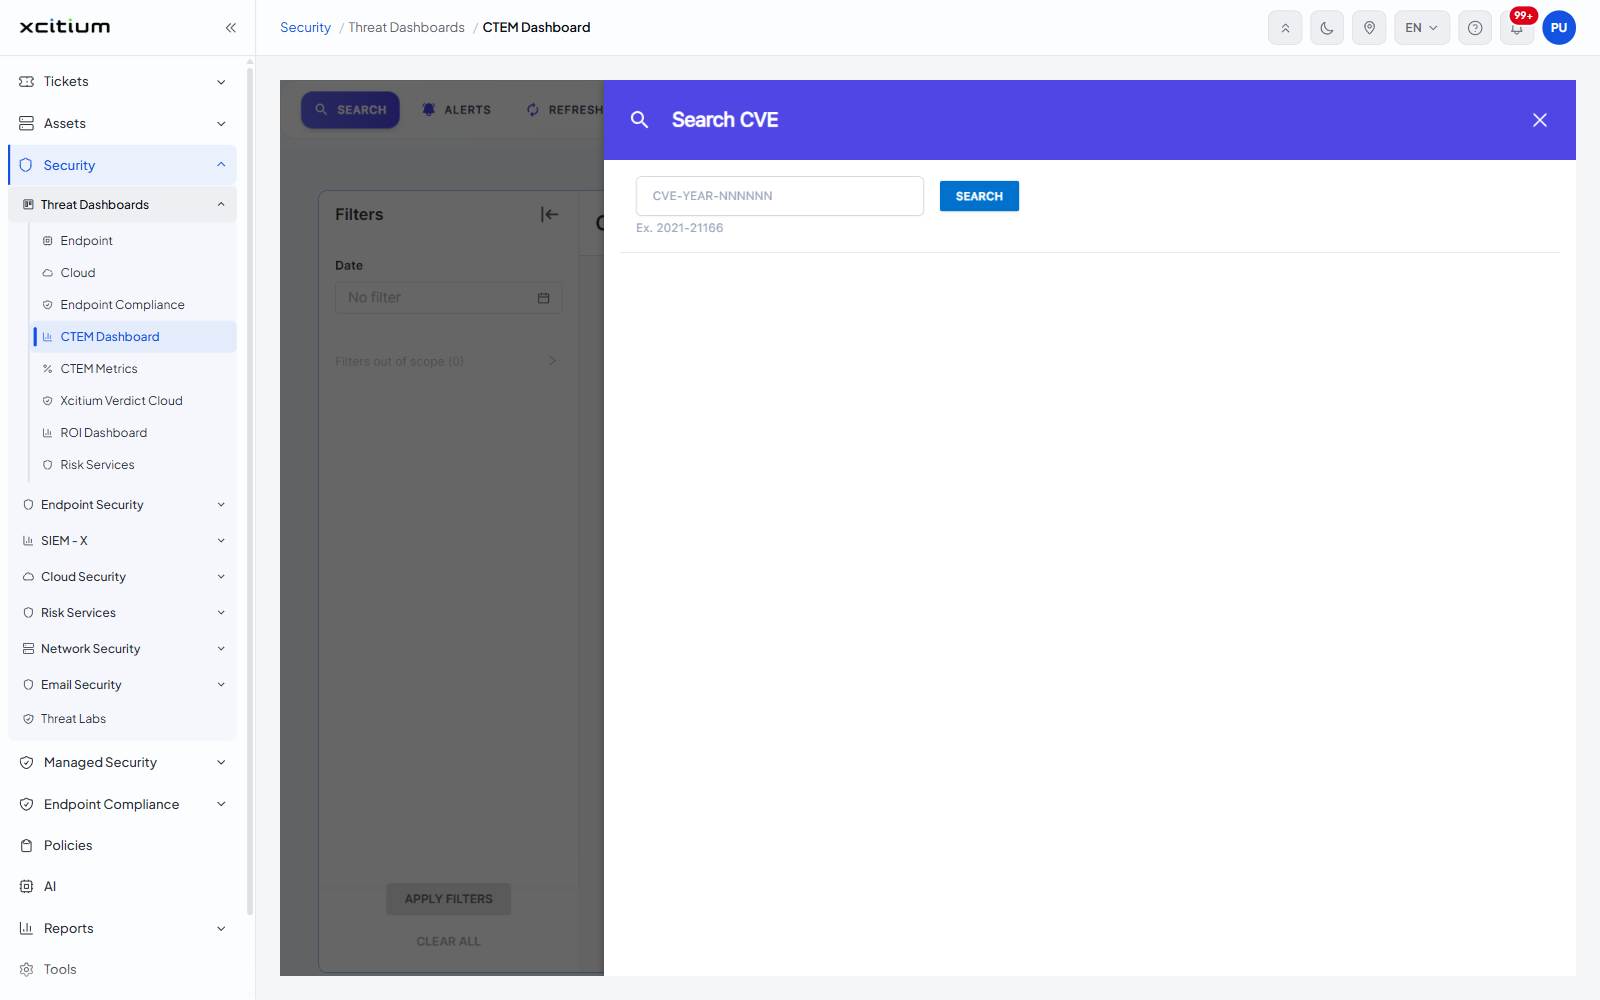
- Click 'SEARCH' again to open the full 'Search CVE' panel across the window. The panel holds one box with the placeholder 'CVE-YEAR-NNNNNN', a 'SEARCH' button and the same hint 'Ex. 2021-21166'.
- Type the CVE identifier and click 'SEARCH'.
- Close the panel with the '×' at its top right.
Read the alerts
- Click 'ALERTS' on the toolbar. A panel headed 'Alerts' opens down the right of the window.
- Under the heading 'System Events' are a 'Start date' and an 'End date' box, both hinted 'MM/DD/YYYY', with calendar buttons.
- The entries are grouped under period headings such as '3 Days Ago' and 'Last Month', newest first.
- Close the panel with the '×' at its top right.
Each alert entry shows a clock icon, the alert title, the date and time, a status pill - 'Open' on every entry seen - and then the lines 'Company:', 'Asset:' (the address and host name), 'Product:' and 'Version:', truncated with a 'Show More' link. A grey chip underneath repeats the matched rule name.
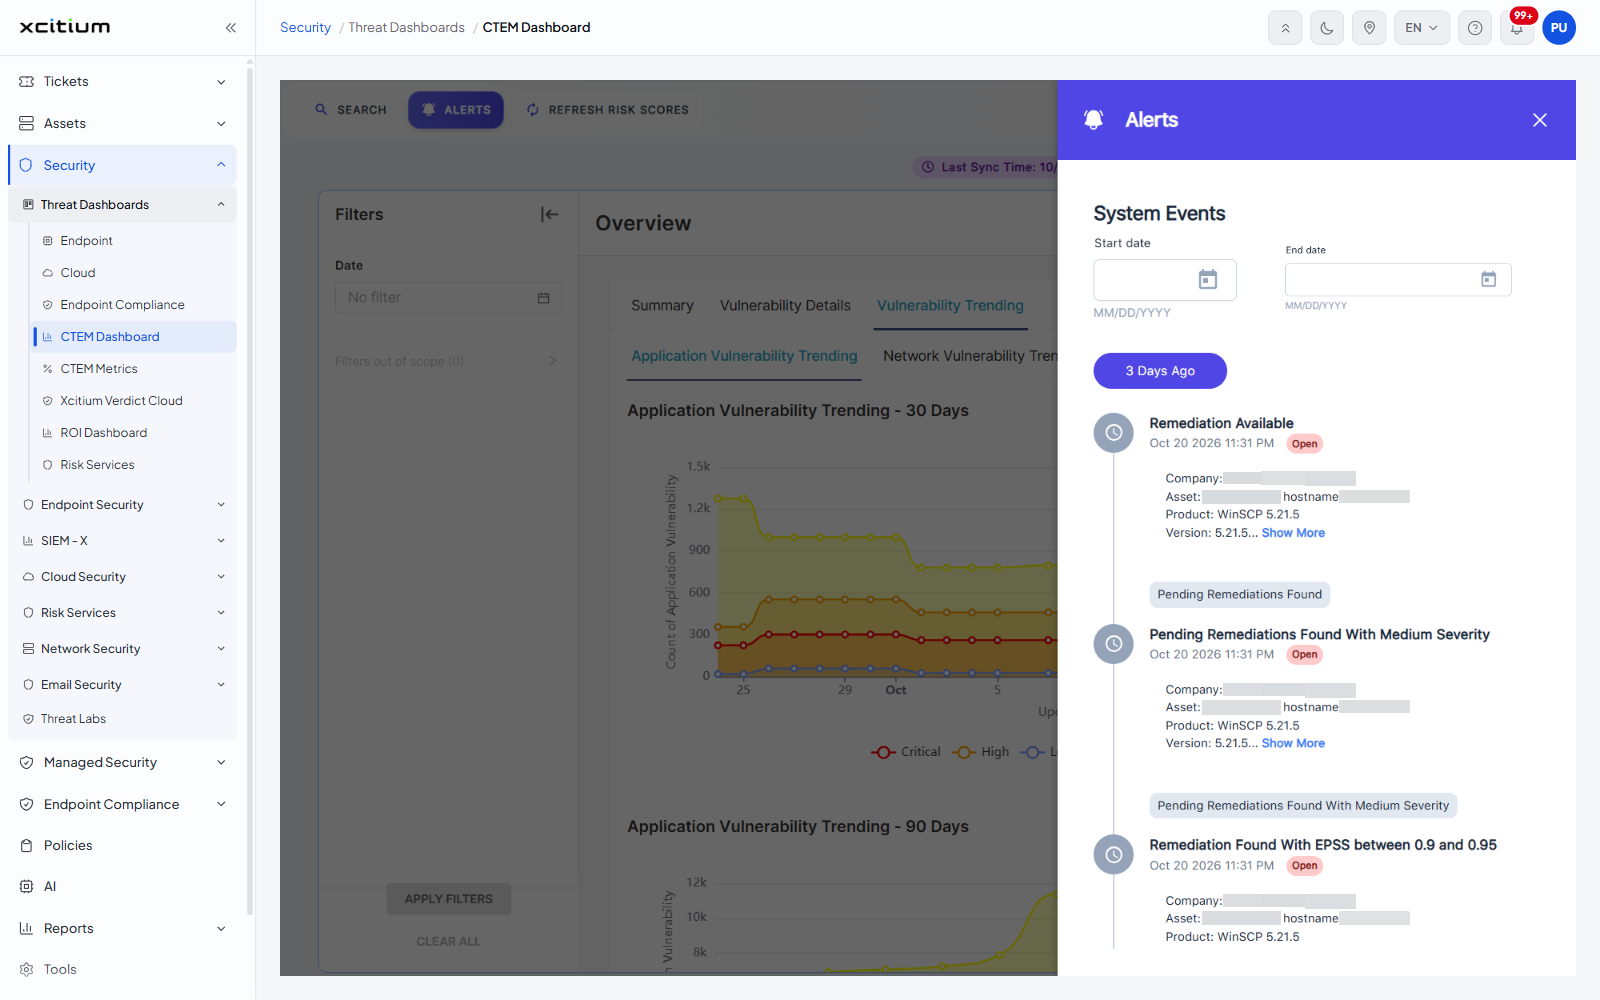
Note: the alert titles seen were 'Remediation Available', 'Pending Remediations Found With Medium Severity', 'Pending Remediations Found With Critical Severity', 'Pending Remediations Found With High Severity', 'Remediation Found With EPSS between 0.9 and 0.95' and 'Remediation Found With EPSS between 0 and 0.85'.