


A Network Monitor's Tabs
- Click 'Assets' > 'Network Management' > 'Monitors', then click a monitor name.
The monitor opens on four tabs: its settings, its conditions, the network profiles that use it and its hit log.
You can rename the monitor, decide whether all or any of its conditions must be met, choose the alert it raises, and say what happens when the probe cannot reach the device at all.
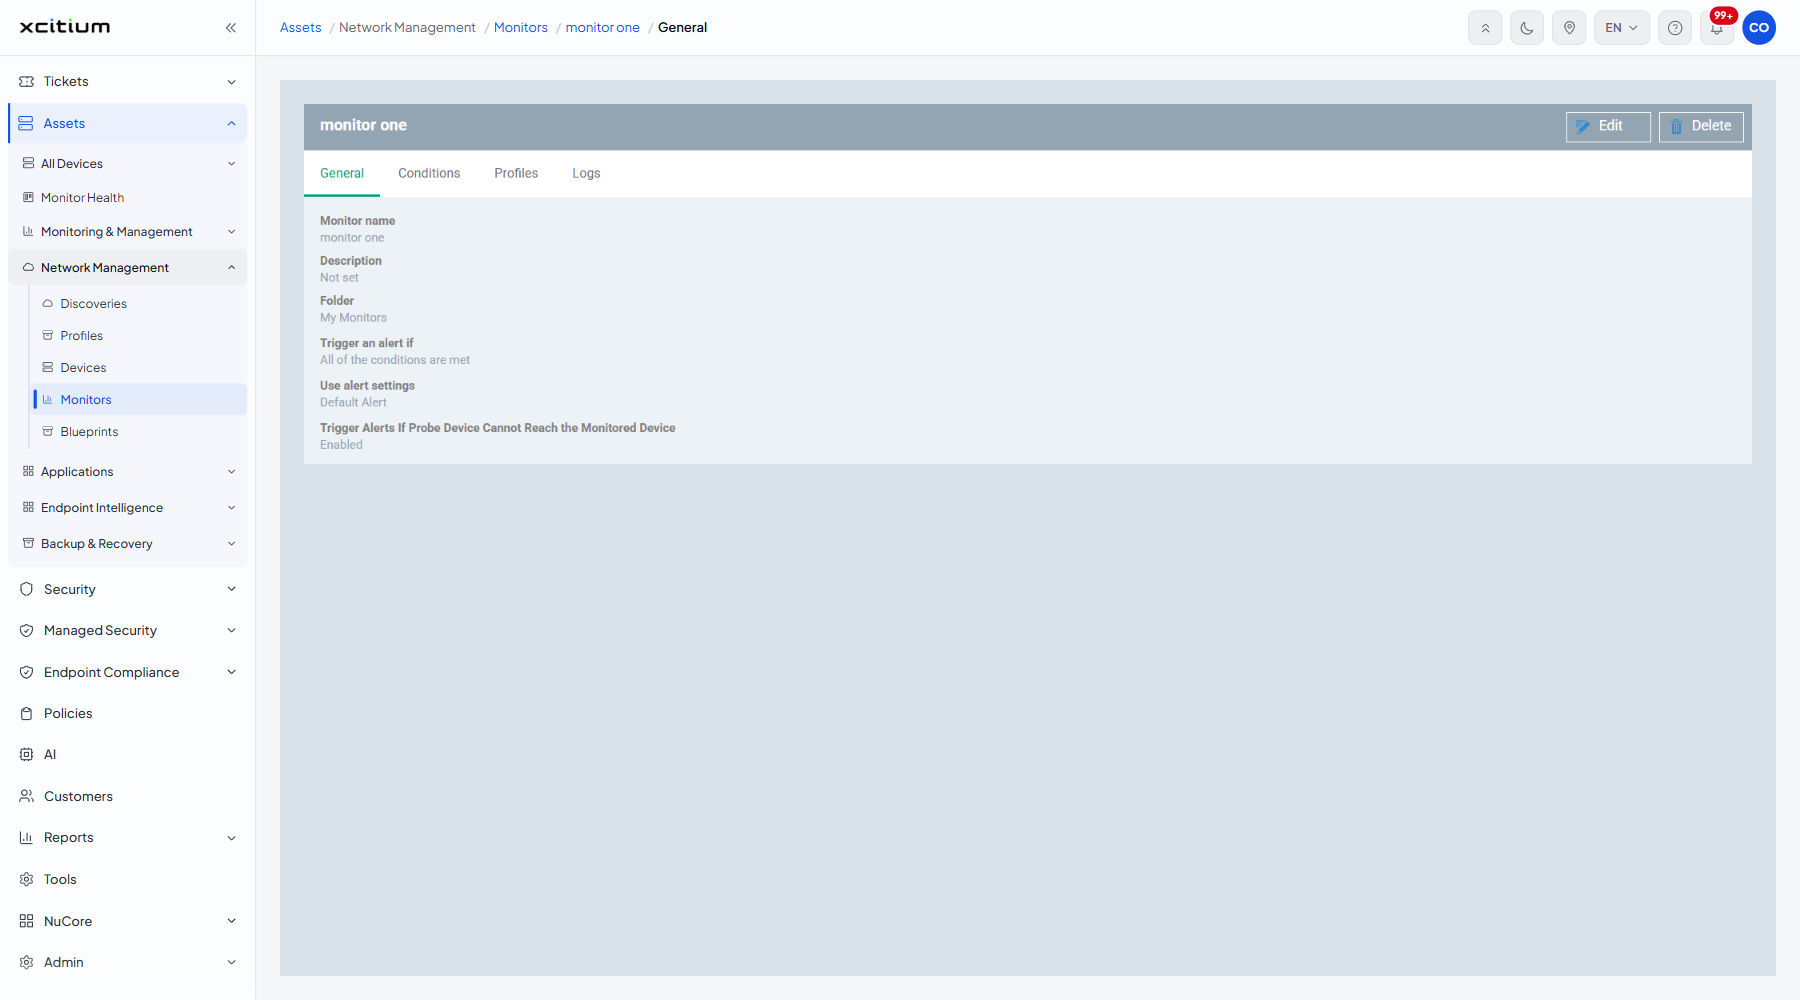
The header and tabs
The header shows the monitor name with two buttons, 'Edit' and 'Delete'. Four tabs sit below it:
- General — the settings on this page. This is the default.
- Conditions — what the monitor watches for.
- Profiles — the network profiles that use the monitor.
- Logs — every time the monitor was triggered.
The settings
| Column | Description |
| Monitor name | The label of the monitor. |
| Description | What the monitor is for. Reads 'Not set' when empty. |
| Folder | The folder the monitor sits in. |
| Trigger an alert if | Whether every condition must be met or just one of them. |
| Use alert settings | The alert raised when the monitor triggers. |
| Trigger Alerts If Probe Device Cannot Reach the Monitored Device | Whether losing contact with the device is itself an alert. 'Enabled' here. |
The Edit form
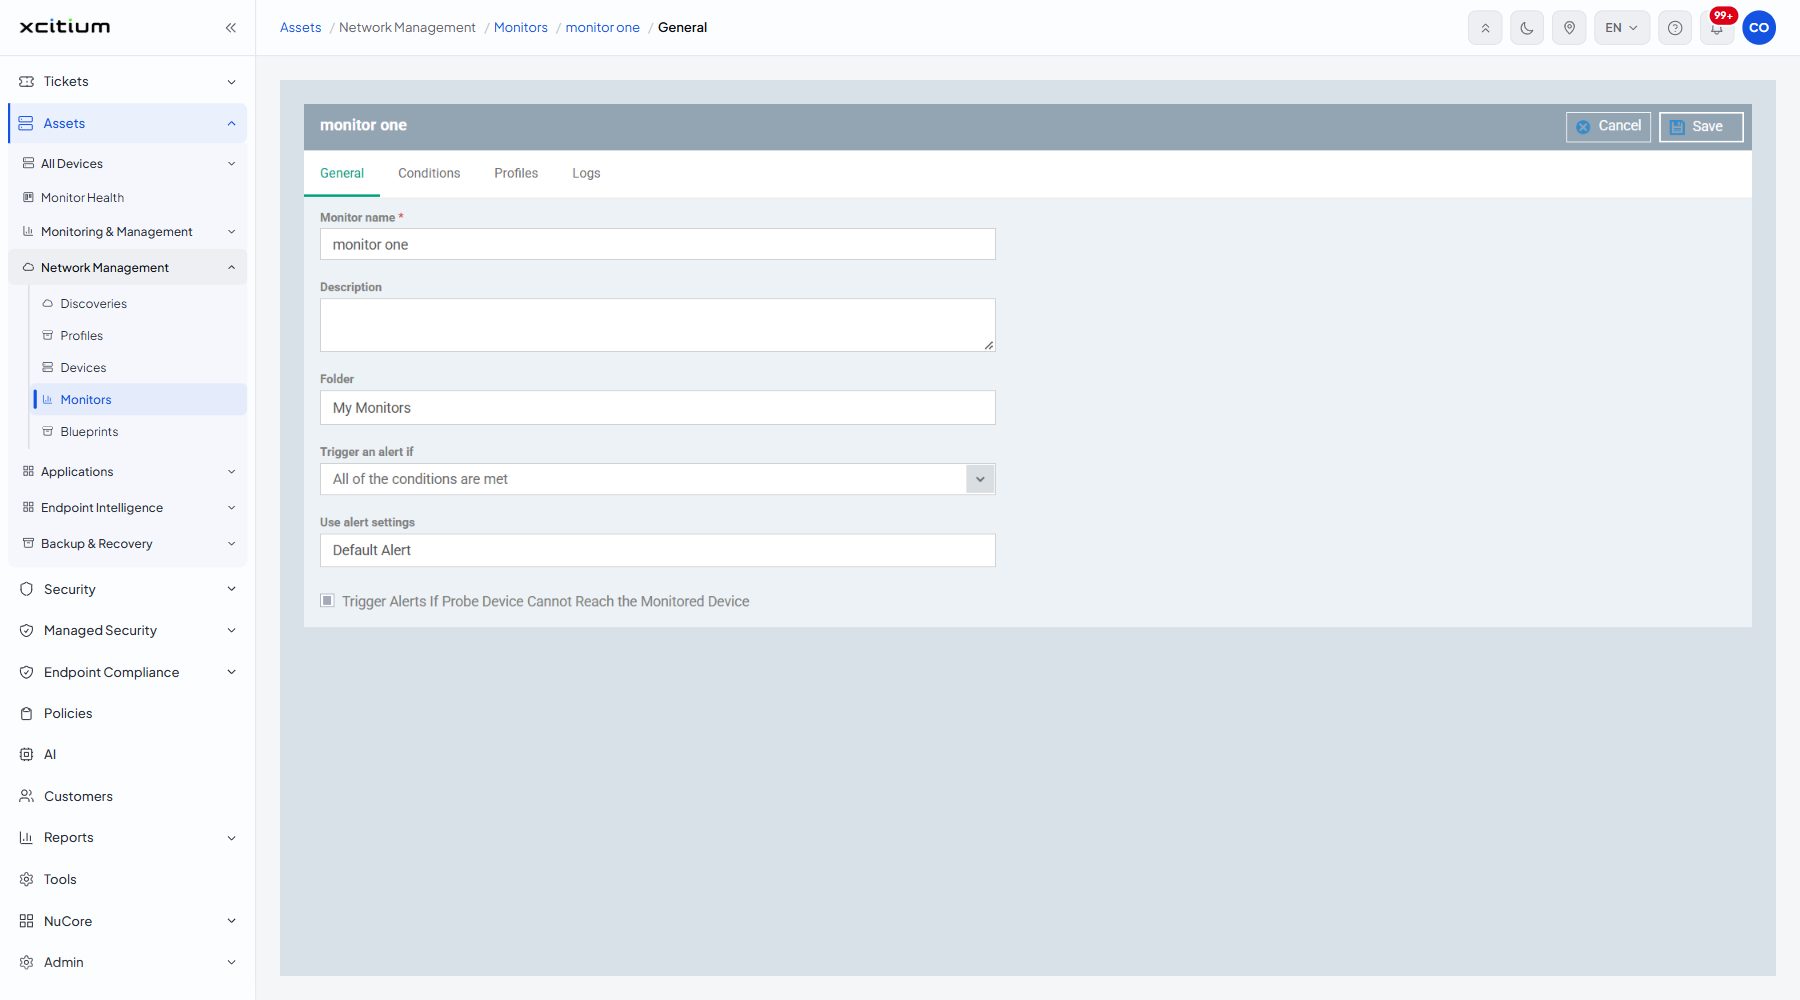
| Field | Type | Options / default | Required |
| Monitor name | Text box | The current name. | Yes |
| Description | Textarea | The current description. | No |
| Folder | Lookup | 'My Monitors' by default. | No |
| Trigger an alert if | Dropdown | 'All of the conditions are met' (default), 'Any of the conditions are met'. | No |
| Use alert settings | Lookup | Type an alert name to search among alerts. | No |
| Trigger Alerts If Probe Device Cannot Reach the Monitored Device | Checkbox | Ticked here. | No |
A network monitor has no 'Auto remediation on alert' setting, because the device it watches has no agent that could run a procedure.
The Profiles tab
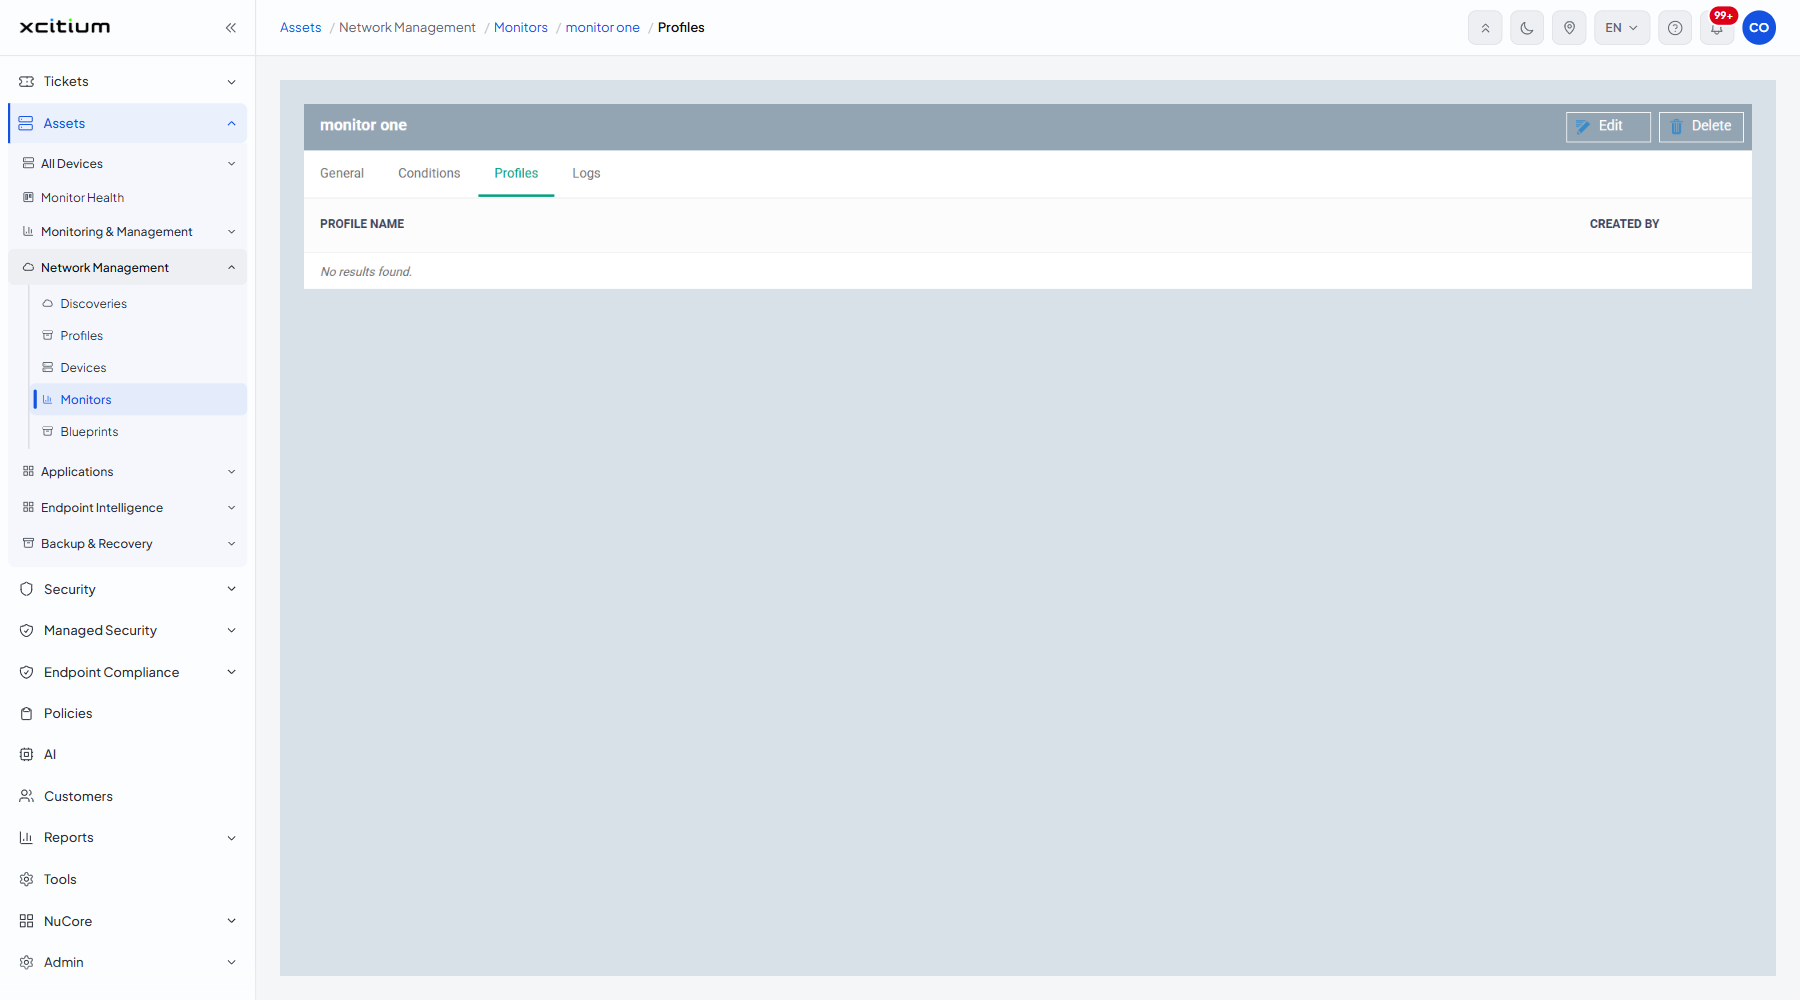
| Column | Description |
| Profile name | The network profile that applies this monitor. |
| Created by | The administrator who created that profile. |
The Logs tab
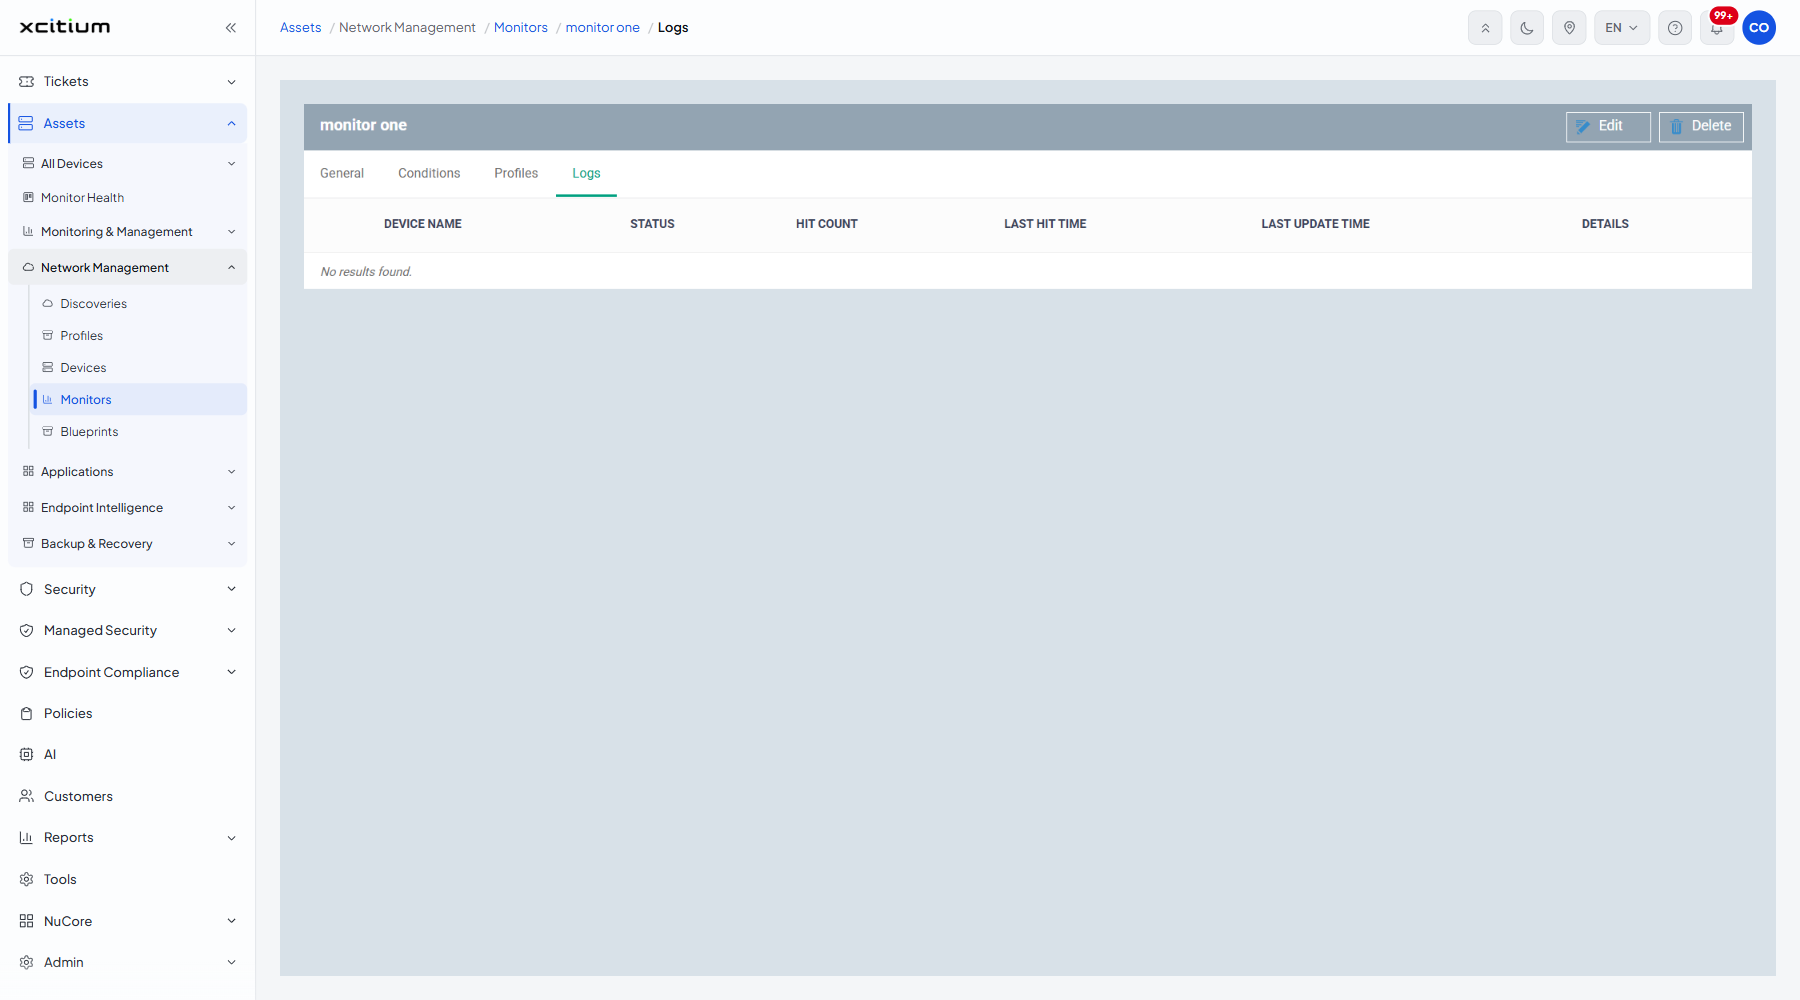
| Column | Description |
| Device name | The network device the monitor was triggered on. |
| Status | Whether the condition is currently met. |
| Hit count | How many times the monitor has been triggered there. |
| Last hit time | When the condition was last met. |
| Last update time | When the row was last refreshed. |
| Details | A link that opens the hit. |
Alert when a device drops off the network
- Open the monitor and click 'Edit' on the General tab.
- Tick 'Trigger Alerts If Probe Device Cannot Reach the Monitored Device'.
- Pick the alert in 'Use alert settings'.
- Click 'Save'.
Note: a network monitor does nothing until a network profile applies it and that profile has a probe device. Check the ‘Profiles’ tab.