


Choose the Endpoint Compliance Widgets
- Click 'Security' > 'Threat Dashboards' > 'Endpoint Compliance' > 'Customize' to open this interface. The breadcrumb changes to 'Security / Threat Dashboards / Endpoint Compliance / Options'.
The 'Selecting Data Set for Audit' page lists every chart the Endpoint Compliance dashboard can draw and lets you decide which of them it draws.
You can switch a data set off, switch it back on, and drag the rows to set the order the charts appear in.
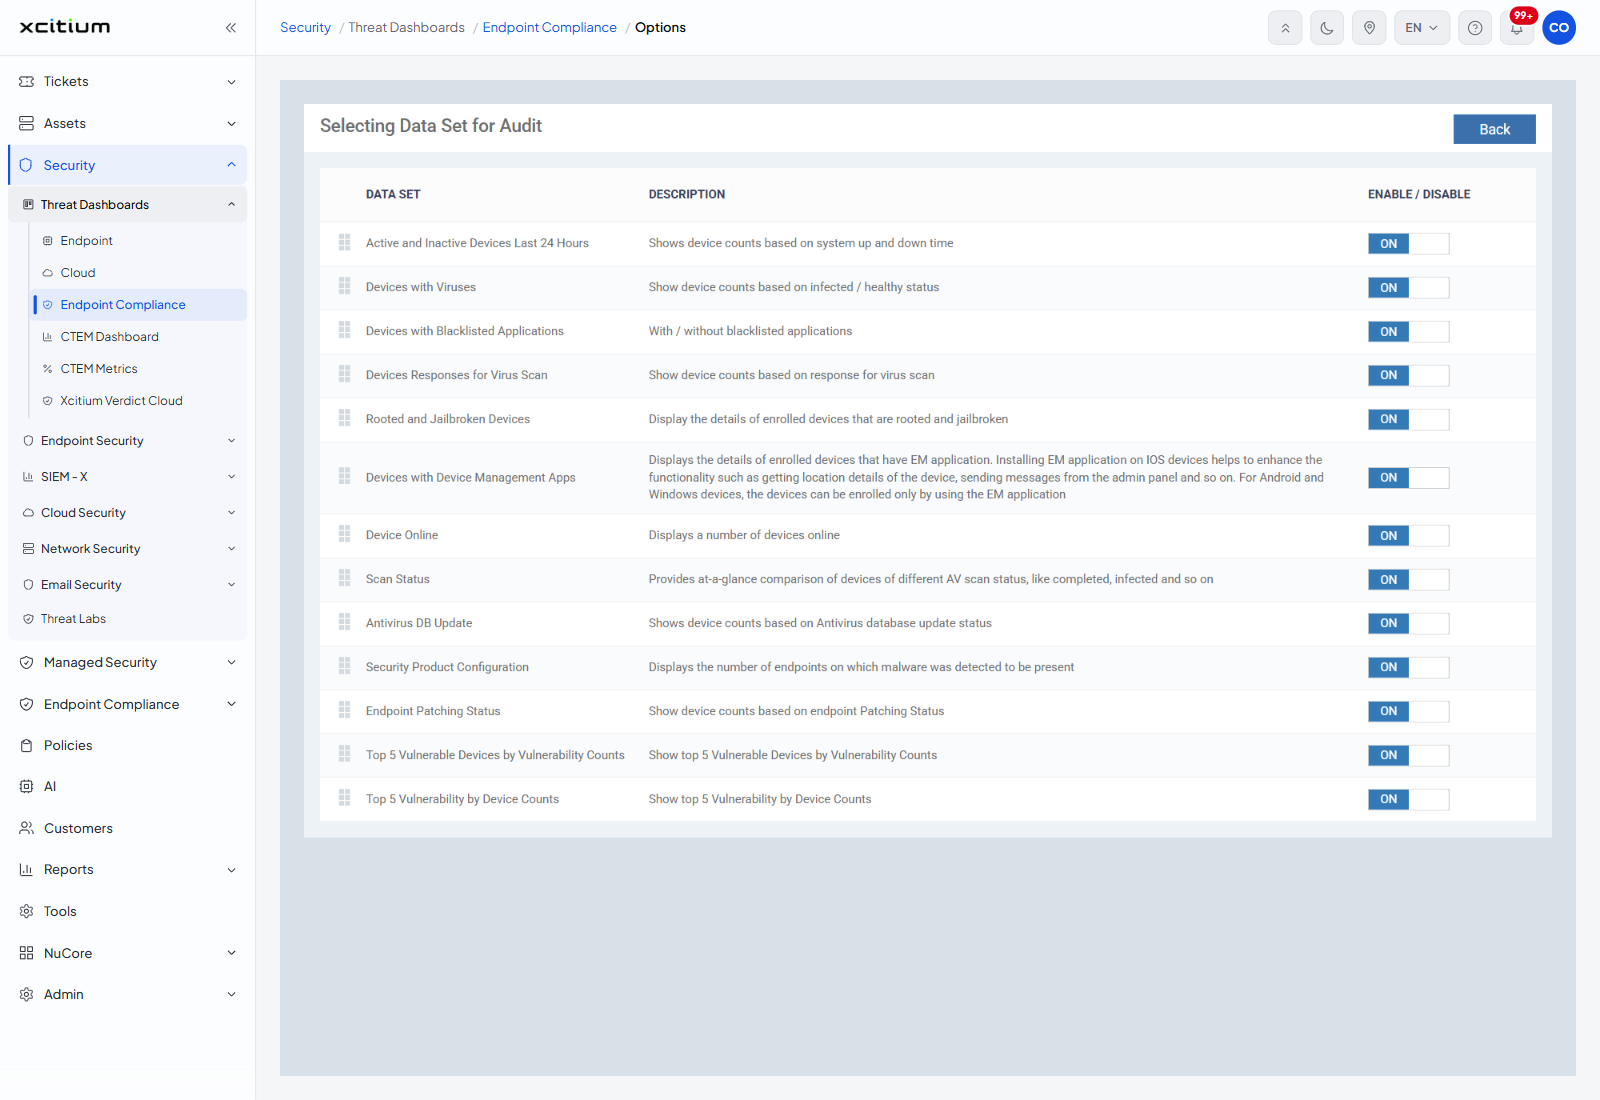
The columns
| Column | Description |
| DATA SET | The name of the chart. A grid handle sits to the left of it; drag the handle to move the row. |
| DESCRIPTION | What the chart counts. |
| ENABLE / DISABLE | A switch reading 'ON' or 'OFF'. Only data sets switched 'ON' are drawn on the dashboard. |
The data sets
| Data set | Description as shown |
| Active and Inactive Devices Last 24 Hours | Shows device counts based on system up and down time |
| Devices with Viruses | Show device counts based on infected / healthy status |
| Devices with Blacklisted Applications | With / without blacklisted applications |
| Devices Responses for Virus Scan | Show device counts based on response for virus scan |
| Rooted and Jailbroken Devices | Display the details of enrolled devices that are rooted and jailbroken |
| Devices with Device Management Apps | Displays the details of enrolled devices that have EM application. Installing EM application on IOS devices helps to enhance the functionality such as getting location details of the device, sending messages from the admin panel and so on. For Android and Windows devices, the devices can be enrolled only by using the EM application |
| Device Online | Displays a number of devices online |
| Scan Status | Provides at-a-glance comparison of devices of different AV scan status, like completed, infected and so on |
| Antivirus DB Update | Shows device counts based on Antivirus database update status |
| Security Product Configuration | Displays the number of endpoints on which malware was detected to be present |
| Endpoint Patching Status | Show device counts based on endpoint Patching Status |
| Top 5 Vulnerable Devices by Vulnerability Counts | Show top 5 Vulnerable Devices by Vulnerability Counts |
| Top 5 Vulnerability by Device Counts | Show top 5 Vulnerability by Device Counts |
Turn a chart off
- Find the row for the chart you no longer want.
- Click the switch in the 'ENABLE / DISABLE' column so that it reads 'OFF'.
- Click 'Back' at the top right. The dashboard reopens without that chart.
Reorder the charts
- Point at the grid handle on the left of a row.
- Drag the row to the position you want.
- Click 'Back' to return to the dashboard.
Note: every data set is switched 'ON' by default.