


Device View
- Click 'Security' > 'Endpoint Security' > 'Alerts' > 'Device View' to open this interface.
'Device View' shows the same alerts as 'Alert Search' but grouped by the device they came from, so there is one row per device. It is the view to use when you want to know which machines are generating the alerts.
You can set the period the view covers, read the top ten devices per component from the widgets, filter the list, open a device's own record, and jump from a count straight to the alerts behind it.
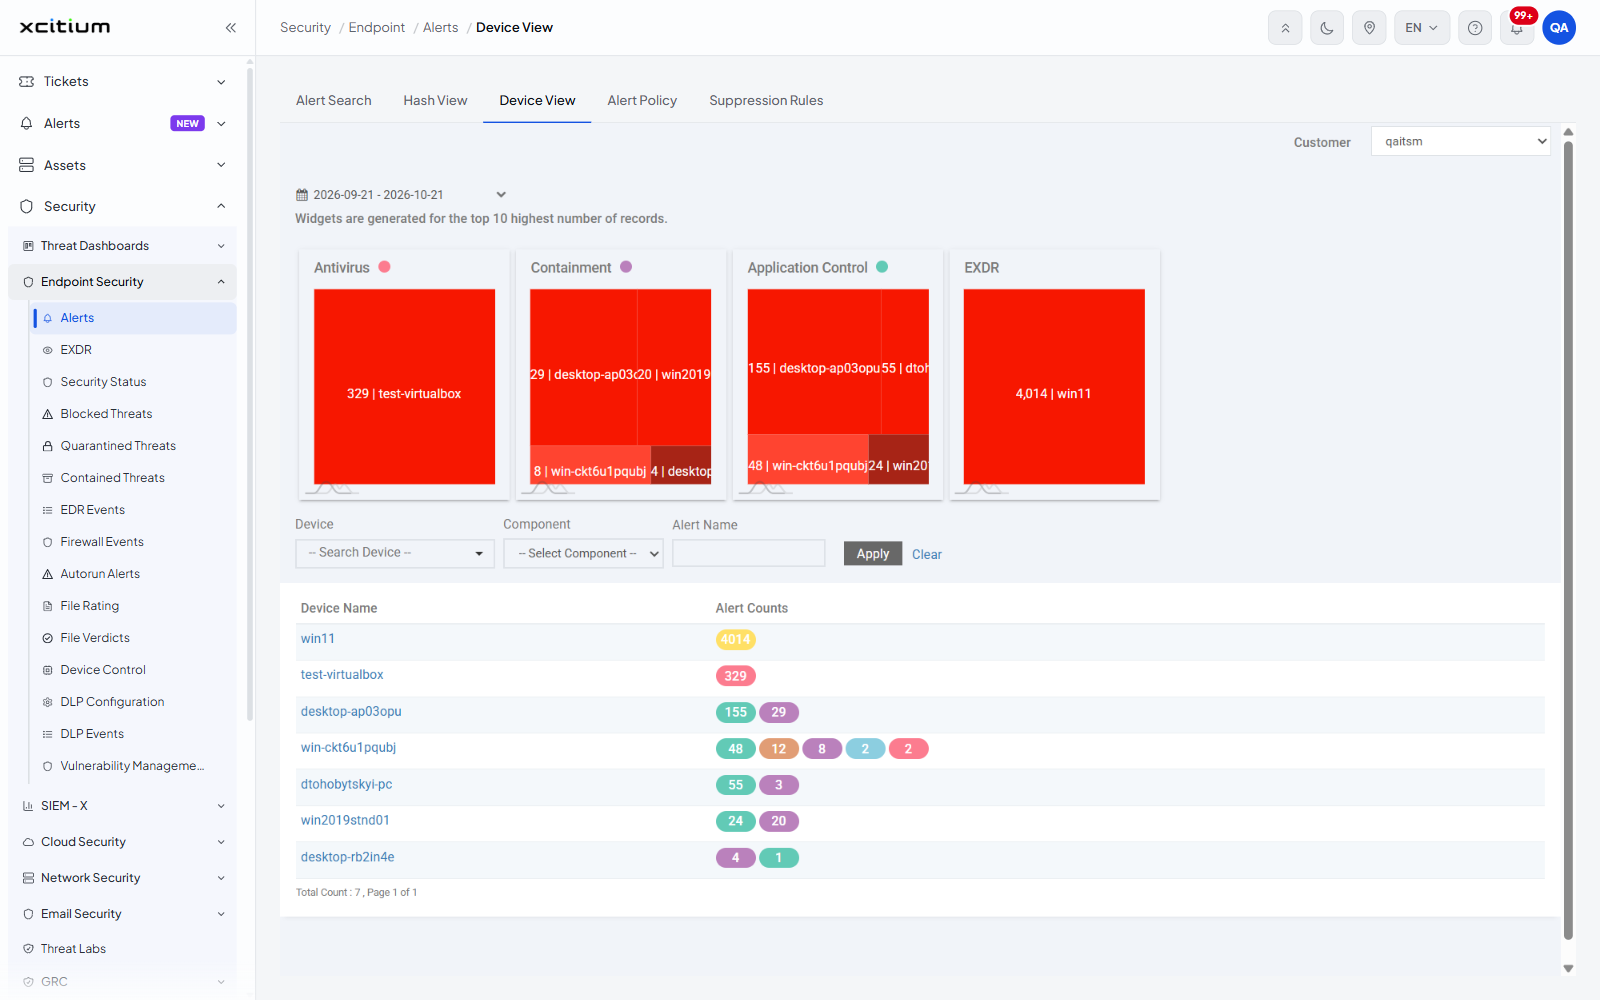
The parts of the tab
| Area | Description |
| Customer | A drop-down at the top right that scopes the tab to one customer. |
| Time range | The control at the top left, showing the period as two dates. It carries a calendar icon and the tooltip 'Time Range Selection', and offers the same choices as on 'Hash View'. |
| Widgets | One tile per component with alerts in the period, under the line 'Widgets are generated for the top 10 highest number of records.' |
| Filter bar | Three filter controls followed by 'Apply' and 'Clear'. |
| Device list | The results table. |
| Pager | A line at the bottom left reading 'Total Count : n , Page x of y'. Page links appear at the bottom right when there is more than one page. |
The widgets
One tile is drawn for each component that raised alerts in the period, for example 'Antivirus', 'Containment', 'Application Control' and 'EXDR'. Each component name carries a coloured dot, and the same colour is used for that component's badge in the 'Alert Counts' column. Inside the tile, one block stands for one device, labelled with the number of alerts and the device name, for example '4,014 | win11'. Only the ten devices with the most alerts are drawn.
The filters
| Filter | Control | Description |
| Device | Search box with suggestions | The device to show. The box reads '-- Search Device --' until you type; type at least one character and the matching devices appear beneath it. |
| Component | Drop-down list | The component that raised the alerts. Options are '-- Select Component --' (the default), 'Antivirus', 'Containment', 'Application Control', 'Autoruns Control', 'Virtual Desktop', 'Containment Activity' and 'EXDR'. |
| Alert Name | Text box | An alert name to match. Free text, no placeholder. |
Filter the device list
- Choose the customer and set the period.
- Set one or more filters.
- Click 'Apply'. The list reloads with the devices that match.
- Click 'Clear' to drop the filters.
The columns
| Column | Description |
| Device Name | The name of the managed device, shown as a link. Click it to open the device's own record. |
| Alert Counts | How many alerts the device raised, in coloured badges. A device with alerts from more than one component shows one badge per component, in the colour of that component's widget. Each badge is a link that opens 'Alert Search' filtered to that device and that component. |
Open the alerts behind a count
- Find the device in the list.
- Click the coloured count badge for the component you are interested in. The alert list for that device and component opens.
The list shows the busiest device first.