Comodo Help
Find the desired product help
Comodo Web Inspector

Comodo Web Inspector

Version 1.0

English

Print Help Download Help
The Administrative Interface > PCI Scanning > Web Inspector PCI Reports > Charts Page
  • Introduction To Comodo Web Inspector
  • The Administrative Interface
    • Logging-in To The Administrative Interface
    • Adding Websites For Daily Blacklist Monitoring And Malware Scanning
    • Managing Websites In Web Inspector
      • Removing A Website From Daily Blacklist Monitoring And Malware Scanning
      • Viewing Last Scanned WI Reports
      • Adding The WI Logo To Your Website
      • Validating Your Website
      • General Website Configuration
        • Disabling / Enabling A Website
        • Changing WI Notification Recipient Email Address
        • Web Inspector Scan Reports
        • False Positives
        • Scanning Options
        • Adding Trust Logo To Your Website
    • Managing Your Account
      • Web Inspector Area
      • My Account
      • Help
      • Contacts
    • PCI Scanning
      • Starting Up With Web Inspector PCI Scanning Service
        • Introduction To The Interface
        • Running Your PCI Scan
        • Viewing Executive Report, Charts And Vulnerability Reports
        • Accessing The Self Assessment Questionnaire
      • PCI Scanning Service - Infrastructure
      • PCI Scan
        • Overview
        • List Of Devices
        • How To Create A New Device
        • Devices Management
        • Start Scanning
        • Viewing A Dashboard Summary Of Scan Results
        • Viewing Executive Report, Charts And Vulnerability Reports
      • Internal Scanning
        • How To Add A New Device
        • Internal Devices Management
        • How To Install The Agent
        • Configuring The Agent
        • Using The Agent - Main Menu
          • HackerGuardian Agent
          • Network Configuration
          • Select A Device For Session Profile
          • Diagnostic Console
          • Shutdown System
        • Start Device Scanning
        • Viewing A Dashboard Summary Of Scan Results
        • View Reports And Statistics
      • Account Preferences And Scan Settings
        • My Account Area
        • Configure Email Alert And Global Alert Options
        • Custom Settings
        • PCI Settings
      • Scheduled Scans
        • Adding A New Scan Schedule
      • Web Inspector PCI Reports
        • Viewing Scan Reports
          • Filtering Options
        • Executive Report
        • Charts Page
        • Vulnerability Report
        • Mitigation Plan
        • Reporting False Positives
        • Downloading Reports Pack
        • Tracking Status Of Submitted False Positives
      • Purchasing Additional IP Packs
    • Web Inspector PCI FAQs
      • Web Inspector PCI Services - General FAQ
      • Web Inspector PCI Services - Technical FAQ
      • PCI FAQ
  • About Comodo Security Solutions

Charts Page


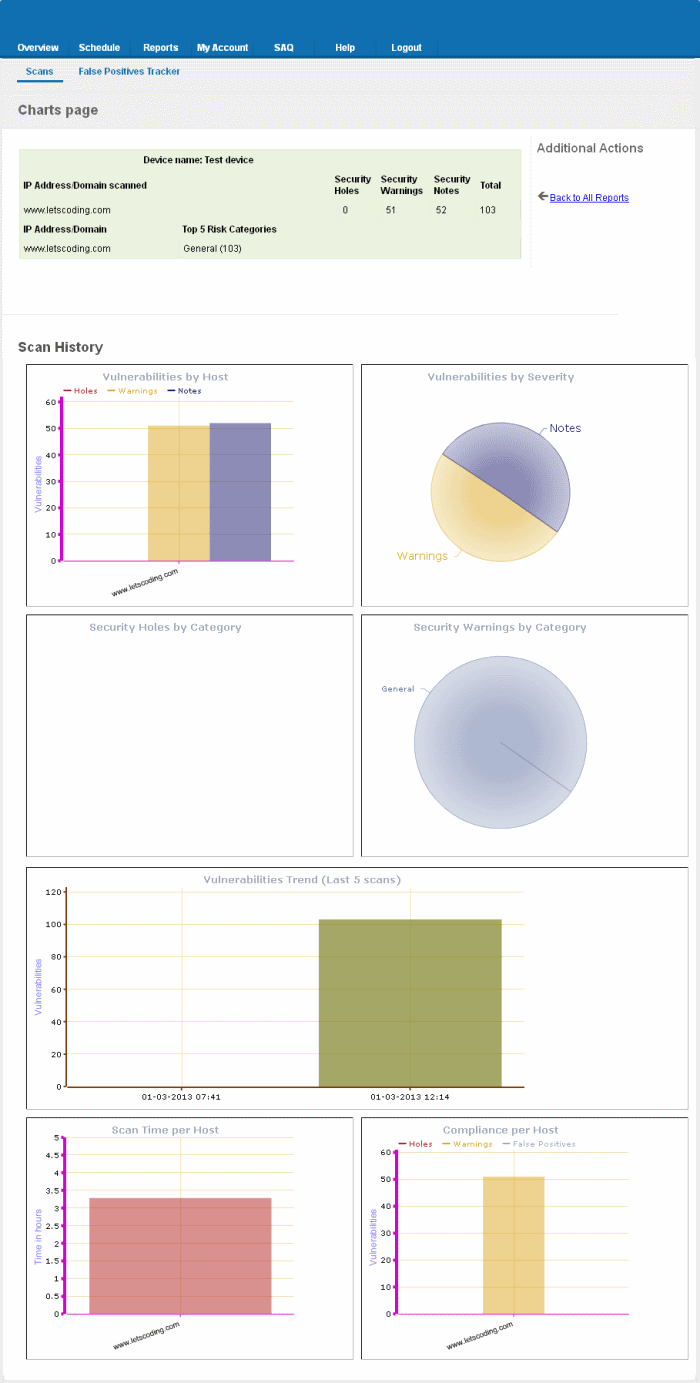
The Charts Page contains at-a-glance summary of the scan results on the device at the top and graphical representations of proportions of identified vulnerabilities according to their categories.


To view the Chart Page of a Device, click the Report Charts button  in the row of the Device.


Tip: You can also click the charts page button beside the Device name from the 'Device List' area to view the page.


An example of the Charts Page is given below.
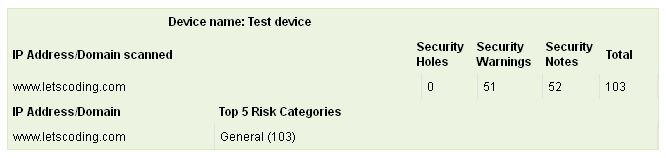


Summary


The summary table provides the list of IP addresses/Domains pertaining to the device scanned and the number of Security Holes, Security Warnings and Security Notes identified in each IP/Domain.


Scan History


The scan history section contains bar-graphs and pie diagrams indicating the proportions of vulnerabilities according to their categories.


Vulnerabilities by Host - A graphical representation of the information regarding the security holes found, security warnings, and security notes per host. Each category is represented by a different color. Pointing the mouse cursor over a bar in the graph displays the count of the respective item found. The graph enables administrators to gain both an overview of the overall of health their network and to monitor the security of individual hosts within that network.


Vulnerabilities by Severity- A pie-diagram representation of proportions of security holes, security warnings, and security notes found for the entire device. Pointing the mouse cursor over a sector in the diagram displays the percentage proportion of the respective item found.


Security Holes by Category - A pie-diagram representation of proportions of security holes of different categories like Trojan Horses, file R/W exploits, Remote Procedure Call (RPC) exploits etc., found for the entire device. Pointing the mouse cursor over a sector in the diagram displays the number and percentage proportion of the respective item found.


Security Warnings by Category- A pie-diagram representation of proportions of security warnings of different categories like Firewall exploits etc., found for the entire device. Pointing the mouse cursor over a sector in the diagram displays the number and percentage proportion of the respective item found.


Vulnerabilities Trend - A graphical representation of the comparison of the vulnerabilities found in the IPs/Domains of the device during the last five scans. This gives the trend of the reduction in the number of vulnerabilities in successive scans because of the remediation actions taken at the end of each scan. Each IP/Domain in a device is indicated with a different color. Pointing the mouse cursor over a bar in the graph displays the number of the vulnerabilities found in the respective IP/Domain in the respective scan. This graph also indicates the administrator on the frequency of the scans and enables to check whether scans are being conducted according to their pre-defined scan schedule.


Scan Time per Host - A graphical representation of the time taken for scanning each IP/Domain in the device. Pointing the mouse cursor over a bar in the graph displays the time taken fr the IP/Domain in hours.


Compliance per Host - A graphical representation of the PCI compliance adhered by the IPs/Domains of the device. Pointing the mouse cursor over a bar in the graph displays the number of security holes, warnings and false positives reported.


Our Products
  • Free Antivirus
  • Free Internet Security
  • Website Malware Removal
  • Free Anti-Malware
  • Anti-Spam (Free Trial)
  • Windows Antivirus
  • Antivirus for Windows 7
  • Antivirus for Windows 8
  • Antivirus for Windows 10
  • Antivirus for MAC
  • Antivirus for Linux
  • Free Endpoint Security
  • Free ModSecurity
  • Free RMM
  • Free Website Malware Scanner
  • Free Device Manager for Android
  • Free Demo
  • Network Security
  • Endpoint Protection
  • Antivirus for Android
  • Comodo Antivirus
  • Wordpress Security
Cheap CDN
  • Bootstrap CDN
  • Semantic UI CDN
  • Jquery CDN
  • CDN Plans
  • CDN
  • Free CDN
Enterprise
  • Patch Management Software
  • Patch Manager
  • Service Desk
  • Website Down
  • Endpoint Protection Solutions
  • Website Security Check
  • Remote Monitoring and Management
  • Website Security
  • Device Manager
  • ITSM
  • CRM
  • MSP
  • Android Device Manager
  • MDR Services
  • Managed IT Support Services
  • Free EDR
Free SSL Certificate
Support Partners Terms and Conditions Privacy Policy

© Comodo Group, Inc. 2025. All rights reserved.