


The Main Interface
The admin console is the nerve center of cWatch, allowing you to enroll networks/endpoints, create log collection policies and more. The dashboard contains at-a-glance statistics about your protected network.
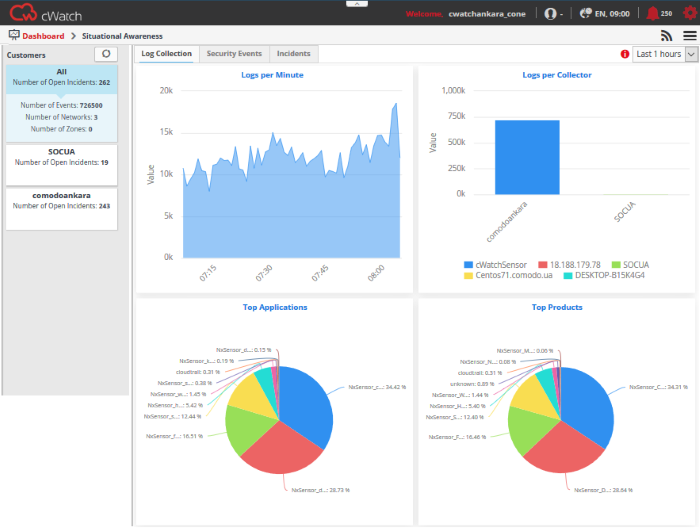
- The title bar shows your username, region, language and the number of alerts you have. The options icon on the right lets you change profile settings and password.
|
Title Bar Controls - Descriptions |
|
|---|---|
|
|
The username of the currently logged-in admin |
|
|
The name of the selected default customer. See 'Change Region and Default Customer' for more details. |
|
|
The location, language and time zone settings as per the currently logged-in admin. |
|
|
The number of incidents detected. Click on the notification icon to open the incident management interface. The interface shows a list of incidents from all customers and lets you reassign them. See Incidents for more details. |
|
|
Allows the currently logged-in administrator to edit their location, language and set default customer. See 'Change Region and Default Customer' for more details. |
 |
Navigational Menu button - Clicking this button allows administrators to navigate to the required main functional areas of the console: Dashboard, Assets, Investigation, Rules, Incidents, Live Lists, Reporting and Administration. |


Main Functional Areas
- Dashboard - A graphical summary of all events, top detected applications, attack sources, firewall event sources and more. See 'The Dashboard' for more details.
- Assets - Add and manage networks for the customers, configure Nxlog and syslog servers and more. See 'Customer Asset Management' for more details.
- Investigation - Create event queries and view the results in pie charts, bar charts and spider charts. See 'Query Management' for more details.
- Rules - Create rules to analyze logs and provide alerts for certain conditions. See 'Manage Rules' for more details.
- Incidents - Manage correlated and default incidents, assign/reassign incidents to users and more. See 'Incidents' for more details.
- Lists - Create values that can be inserted into form fields when creating event queries and correlation rules. For a example, a list might be used to populate the suggestions in a drop-down menu. See Lists for more details.
- Reporting - Generate customer specific reports. Reports are available for different kinds of events such as login failures and successes, suspicious login attempts and more. See 'Manage Reports' for more details.
- Administration - Download log collection utilities in order to deploy them on Windows and Linux servers. See 'Administration' for more details.
Change Region and Default Customer
- Click
the user setting button
 and choose 'Region & Language' from the
drop-down.
and choose 'Region & Language' from the
drop-down.
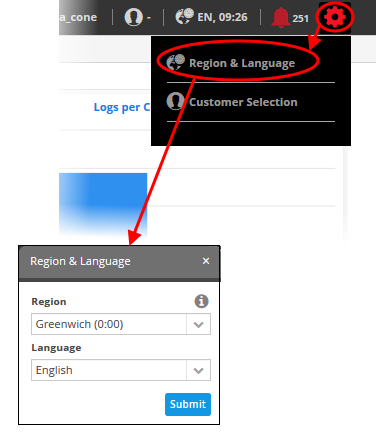
The 'Region and Language' dialog
will appear.
- Choose the region and time zone to be followed from the 'Region' drop-down.
- Choose the language in which the cWatch Network web console is to be displayed from the 'Language' drop-down.
- Click the 'Submit' button.
A confirmation message will
displayed.

The settings will be changed and will take effect from your next login.
Customer
Selection
- After logging in, by default, the dashboard will show statistics for all customers.
- You can configure cWatch to display statistics for a particular customer throughout the logged-in session. For example, if you navigate to different screens and return to dashboard, the statistics for the selected customer will be shown.
- Note – This setting is valid only for the session.
- Click
the user setting button and choose 'Customer Selection' from the
drop-down.
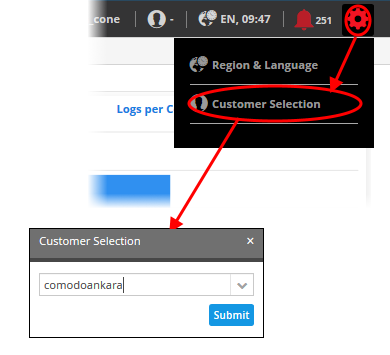
The 'Customer Selection' dialog
will appear.
- Choose the customer the drop-down.
- Click the 'Submit' button.
A confirmation message will displayed.
Support
At the bottom of the interface, clicking the 'Help' and 'Tutorials', opens the respective support pages.
- Help - Opens Comodo cWatch Network online help guide at https://help.comodo.com
- Tutorials - Opens the tutorials page that contains instructions and videos
for some important tasks.