View Protection Statistics
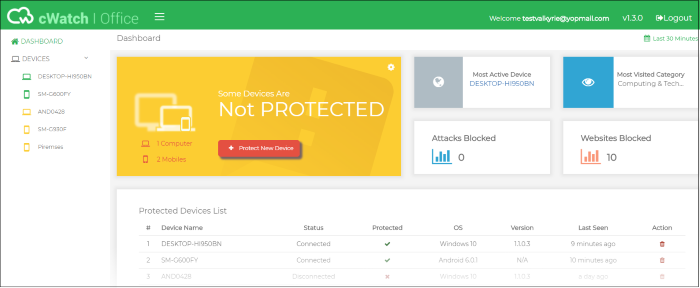
The dashboard shows protection and browsing statistics for your devices. Statistics include websites visited, websites blocked, attacks blocked and more.
- The
'Dashboard' - Data on all devices enrolled for your account.
- The
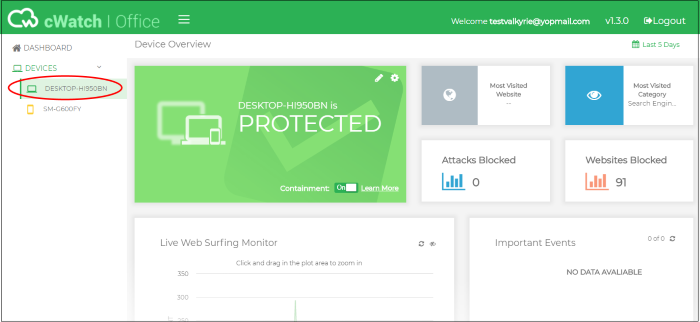
'Device Overview' - Data on specific device.
- Click 'Dashboard' on the left to open the dashboard.

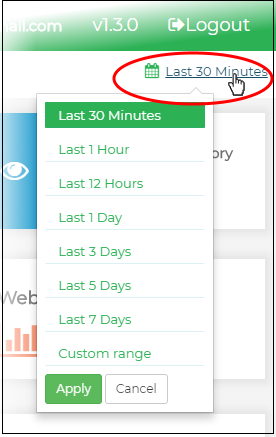
- Use the date range picker at top-right to choose the time period of the statistics:

The 'Dashboard' contains the
following tiles:
- Overall protection status - Shows how many enrolled devices are connected to cWatch protection. It also allows you add new networks/devices and view default protection settings.
-
Most active device - The device which has visited the largest number of sites / pages within the selected time period. This includes both allowed and blocked websites.
- Most visited category - The website category visited most often by devices in your network.
- Attacks blocked - The total number of attacks blocked on all enrolled devices/networks within the selected period.
- Websites blocked - The total number of website access attempts that were intercepted and blocked on all devices.
- Protected Devices List - Shows all devices that have been enrolled to cWatch, along with details like the device name, OS and connection status.
- Live web surfing monitor - Shows the number of websites visited by each enrolled device during the selected time-period.
-
Important events - A timeline of noteworthy security events across all devices/networks in the selected time period. Events can include blocked websites and potential attacks which were prevented by cWatch Office.
- Most visited websites - The ten websites visited most often by all devices in your cWatch network.
- Most blocked categories - The ten website categories which were most often visited and blocked in your cWatch network.
- Last visited websites - The 100 websites most recently visited by devices in your cWatch account.
- Top devices - The ten devices which made the most website requests within the selected time-period.
- Click the name of a device/network on the left to open the 'Device Overview' page:

- The date picker at top-right lets you choose the time period of the statistics:

The 'Device Overview' page contains the following tiles:
- Device protection status – Shows whether or not the device is connected to the cWatch console. It also allows you to view and manage the protection settings in effect on the device.
- Most visited website - The website most often visited by the device.
- Most visited category - The website category visited most often by the device within the selected period.
- Attacks blocked - The total number of attacks blocked on the device within the selected period.
- Websites blocked - The total number of website access attempts that were intercepted and blocked on the device.
- Live web surfing monitor - Shows the number of websites visited by the device during the selected time-period.
- Important events - A timeline of noteworthy security events on the device in the selected time period. Events can include blocked websites and potential attacks which were prevented by cWatch.
- Most visited websites - The ten websites visited most often by the device.
- Most blocked categories - The ten website categories which were most often visited and blocked on the device. The categories blocked depend on the protection settings active on the device.
- Last
visited websites - The 100 websites most recently visited by the
device.


