Summary Reports
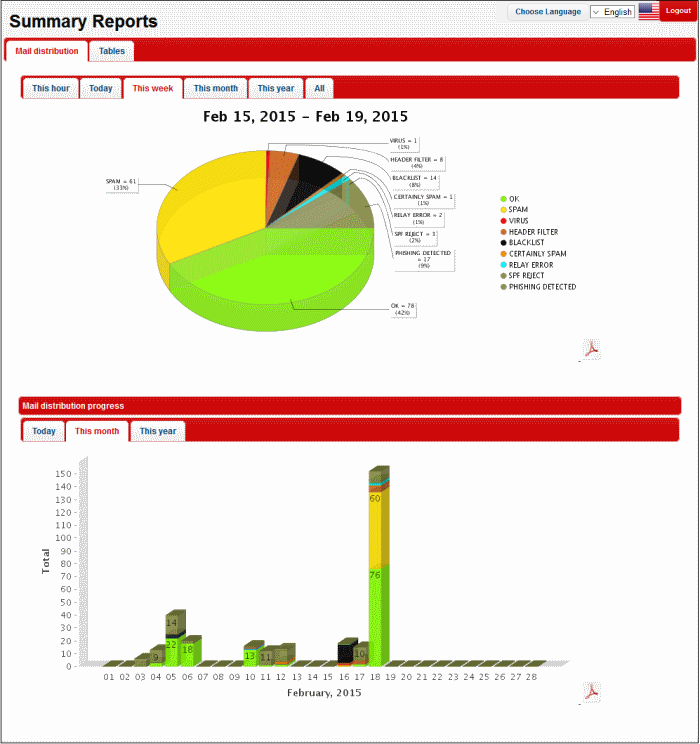
- The 'Summary Reports' screen in KoruMail provides a comprehensive report of filtering results of mails for all domains that are enrolled.
- The summary report is available as pie chart, bar chart and table formats.
- The tabs at the top of the interface allows to view and download the reports in graphical or table format.
- The upper portion of the screen displays the report in pie chart format and is available for hourly, daily, weekly, monthly, yearly and full from the time of installation.
- The lower portion displays the results in bar chart format and is available on hourly, monthly and yearly basis.
To open the 'Summary Reports' interface
- Click 'Reports' and then click 'Summary Reports'
You can view and download the
reports in graphical as well as in table format.
To view and download the report in graphical format
- Click the 'Mail Distribution' tab at the top
The results in pie chart format at the top and bar chart format at the bottom will be displayed.
-
To view the results for a particular period, click the relevant tabs at the top.

- Click the desired period for which you want to view and download the report. The available periods are hourly, daily, weekly, monthly, yearly and from the time of KoruMail installation.
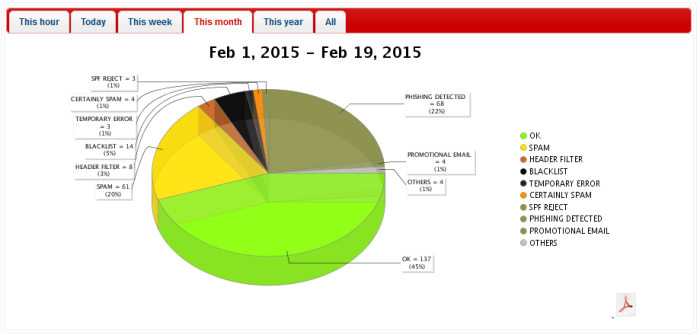
The different segments of the pie chart provides the details of the filtering results for the selected period such as mails categorized as spam, phishing, blacklisted and so on.
- To download the pie chart results, click the PDF icon

The pdf and xls files will be downloaded to the local folder.
- Click the desired period for which you want to view and download the report in bar chart format. The available periods are daily, monthly and yearly.

The report for the selected period
will be displayed.
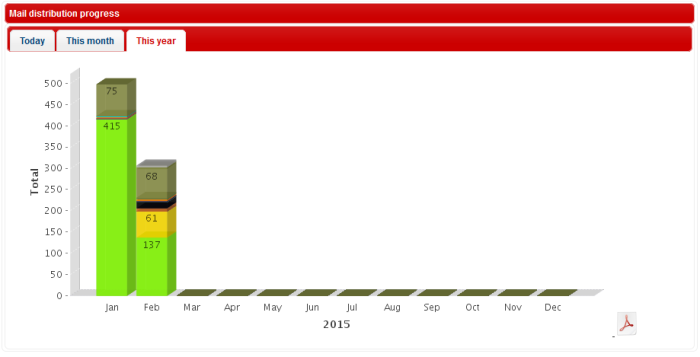
The Y-axis displays the number of mails and X-axis displays the hours/days/months for the selected period.
-
To download the bar chart results, click the PDF icon

The pdf and xls files will be downloaded to the local folder.
To
view and download the report in table format
- Click the 'Tables' tab at the top of the 'Summary Reports' screen.

The report in table format is available for the periods hourly, daily, weekly, monthly, yearly and from the time of KoruMail installation. You can also define a period and generate a custom report.
- Click the desired period for which you want to view and download the report in table format.
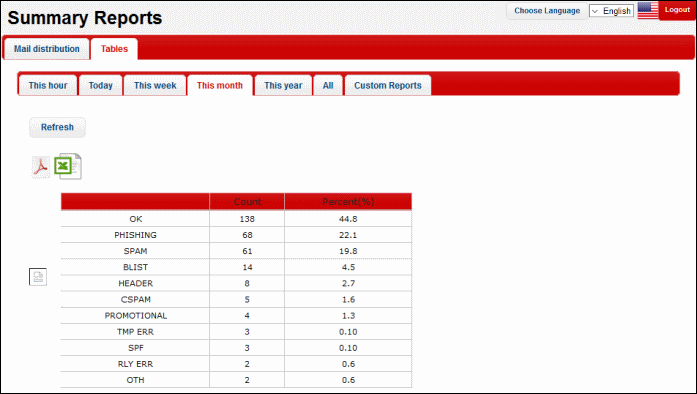
The report for the selected period will be displayed. The first column indicates the categorization of mails, the second column displays the number for each category and the third column provides the results in percentage for each category.
- To download the report in PDF format, click the PDF icon

- The pdf and
xls files will be downloaded to the local folder

To generate a custom report in table format
- Click the 'Custom Reports' tab at the top
The fields to select the 'From' and 'To' period will be displayed.
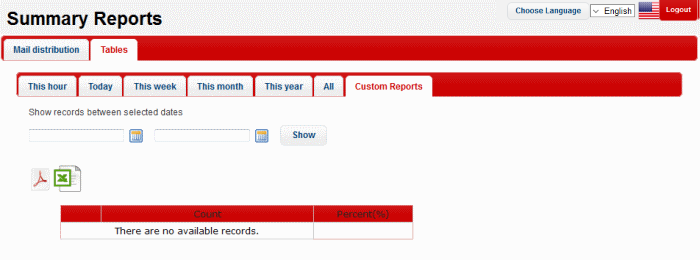
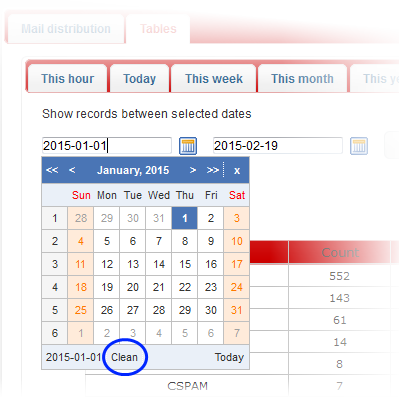
- Click on the fields or calendar icon and select the period from the calendar.
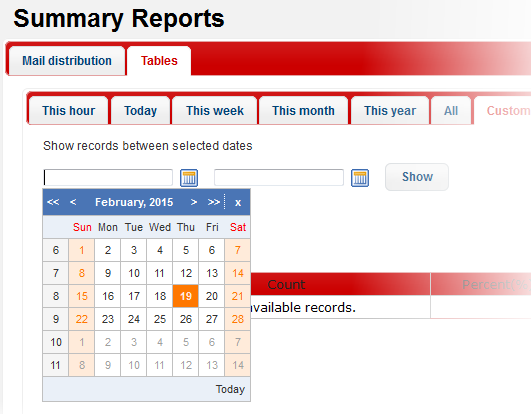
- Click the 'Show' button after selecting the custom period.
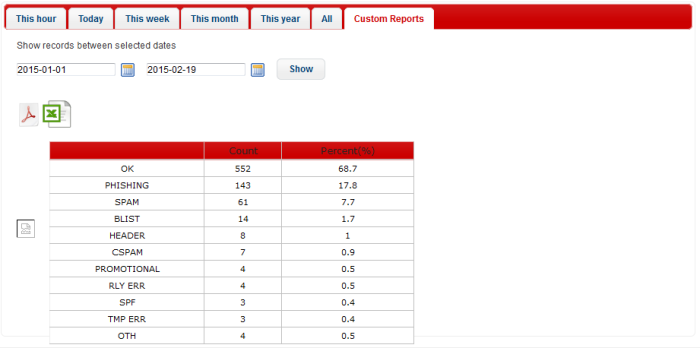
The report for the selected custom period will be displayed. The first column indicates the categorization of mails, the second column displays the number for each category and the third column provides the results in percentage for each category.
- To download the custom report in PDF format, click the PDF icon
 and click 'OK' in the download dialogue to save the report.
- To download the custom report in XLS (spreadsheet) format, click the
XLS icon
 and click 'OK' in the download dialogue to save the report.
- To clear the custom period, click on the period fields or calendar icon and click the 'Clean' button.
