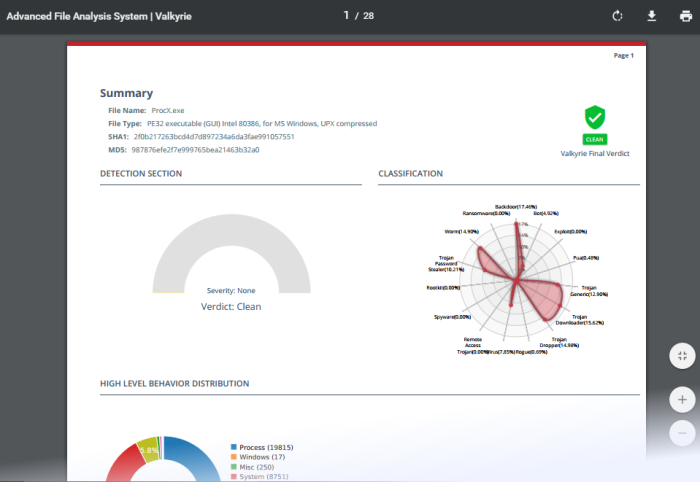
Kill Chain Report
- Kill Chain reports are a highly detailed analysis of a specific piece of malware that was discovered on your network. Each report helps you gain a better understanding of your network's threat landscape by detailing each files malware attributes, file activity, network activity, suspicious behavior and more.
- Existing Kill Chain reports can be viewed in the web portal by all users.
- Premium license holders and Xcitium users who have a 30-day trial can request new Kill Chain reports.
To view 'Kill Chain' report
- Click the hamburger button top-left
- Click
'Recent Analysis Requests'
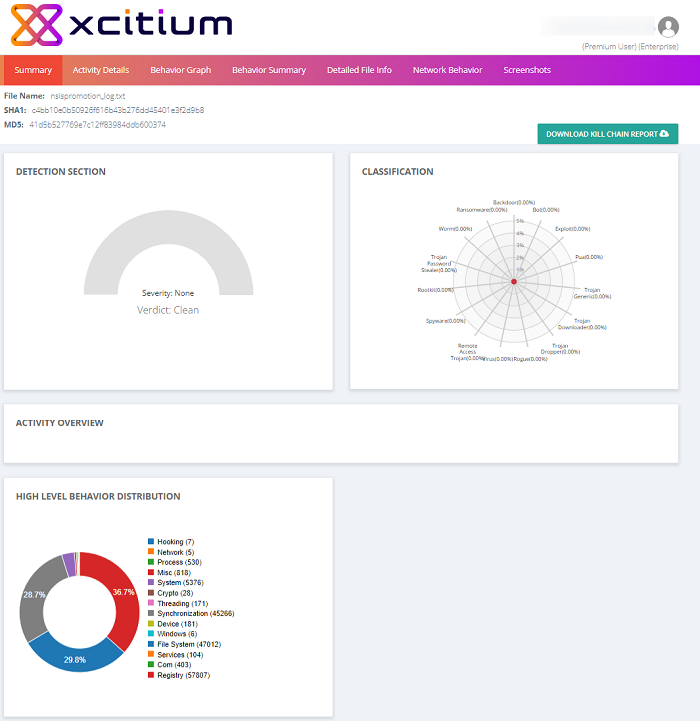
- Click
the 'Send to Kill Chain Report' icon
 to generate a Kill Chain
report for the selected file.
- It will
take up to 30 minutes to generate the report. Once the report is
ready, click the 'Kill Chain Report' icon
 to download it.
- You can view files that belong to your Xcitium account by choosing your login name from the 'Recent Analysis Requests'.
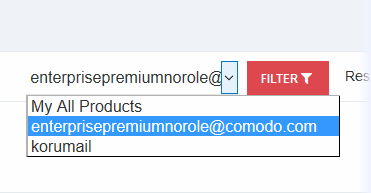
Summary
The summary area displays basic file details such as name, type and SHA1/MD5 values, along with the malware's classification and overall behavior.
- Detection Section – Shows the malware's overall severity level. The levels are Low, Moderate, High and Severe.
- Classification – An attribute matrix which shows the types of malicious behavior exhibited by the malware, and the percentage each behavior contributed to the file's total activity. This allows you to see the threat profile of the file by mapping its observed actions to those of well-known malware types.
- Activity Overview – Shows the broad attack categories used by the malware and the number of specific actions within each category. The 'Activity Details' section further down the report expands upon this information.
- High
Level Behavior Distribution – Shows how the malware's
behavior was spread across various operating system and network
activities.
Activity Details
The activity details section displays the attack types exhibited by the malware. The information in this section is an expansion of that shown in the 'Activity Overview' bar-chart.
- Click the 'Activity Details' tab to open this section.
- Each item consists of a broad attack category followed by specific actions which fall into that category. The aggregate threat rating for all actions in a category is shown on the right.
- The category names illustrate the goal of the attack. Actions are the techniques used to achieve the goal.
- A
single piece of malware may have multiple goals and may attempt
multiple actions to achieve them.
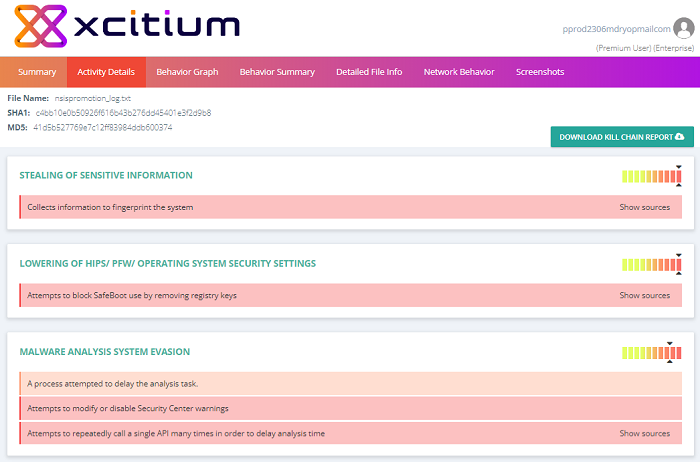
- Click the 'Show sources' link to expand a section
Behavior Graph
The behavior graph section displays all activities executed by the malware as a timeline. Each activity is time-stamped and color-coded according to severity level.

- Place your mouse over the graph to view detailed descriptions about a particular activity.
- Click the arrow on the top left to expand or collapse any section.
Condenses the activities of the malignant file. This includes the files and registry keys it accessed, resolved APIs and deleted files.
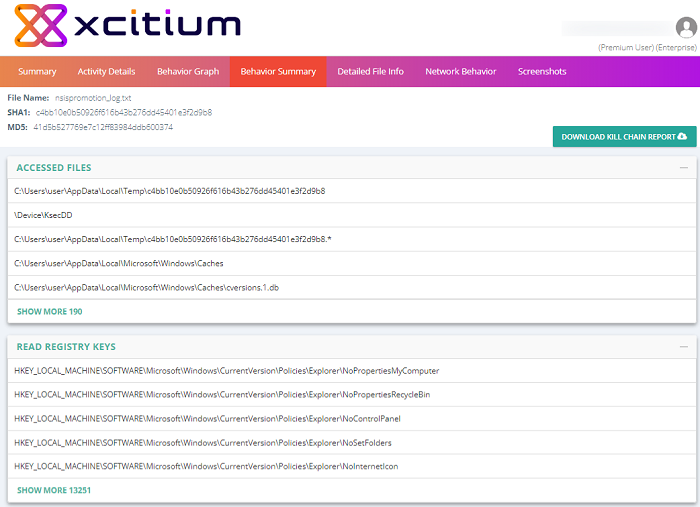
- Click '+' to expand any section
Detailed File Info
- The location, type and hash of all files created by the malware
- An overall summary of malware details, including name, type, hashes and trust verdict after human analysis
- Additional file information – A detailed list of PE headers, sections and imports
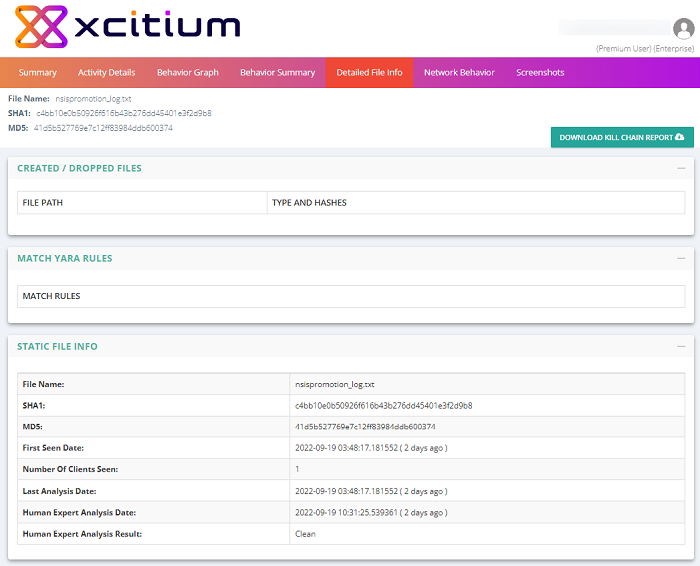
- Click the '+', to expand the file info field
Network Behavior
Provides detailed information about the malware's activities across your network.
Note. It is possible that some queries you see in this section were made by native Windows services. The Verdict server tests files on a machine running only Windows and the executable being tested.
- Click
the 'Network Behavior' tab to open this section:
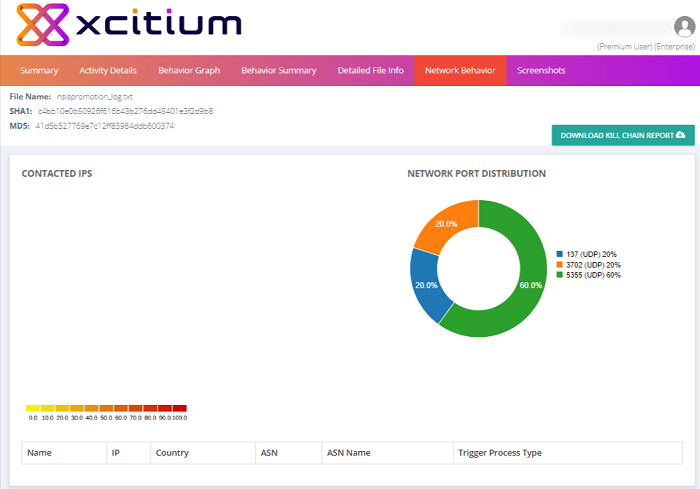
The section contains the following areas:
- Contacted IPs - Lists all domains and the IP addresses that were contacted during the testing process. Each row also contains the autonomous system number (ASN) and ASN name to which the IP address belongs.
- Network Port Distribution - Graph which shows the port numbers and protocols used for communication during the testing process. The percentages show much traffic was sent through a particular port as a percentage of the malware's total traffic.
- HTTP Packets - Shows all communications using HTTP packets during the testing period. A large number of connections could show the malware is involved in a denial of service attack.
- DNS Queries/Answers - Shows all domains for which DNS requests or answers were made during the testing period.
- TCP Packets - Shows all communications using TCP packets during the testing period. A large number of connections could show the malware is involved in a denial of service attack.
- UDP
Packets - Shows all communications using UDP packets during the
testing period. A large number of connections could show the malware
is involved in a denial of service attack.
Screenshots
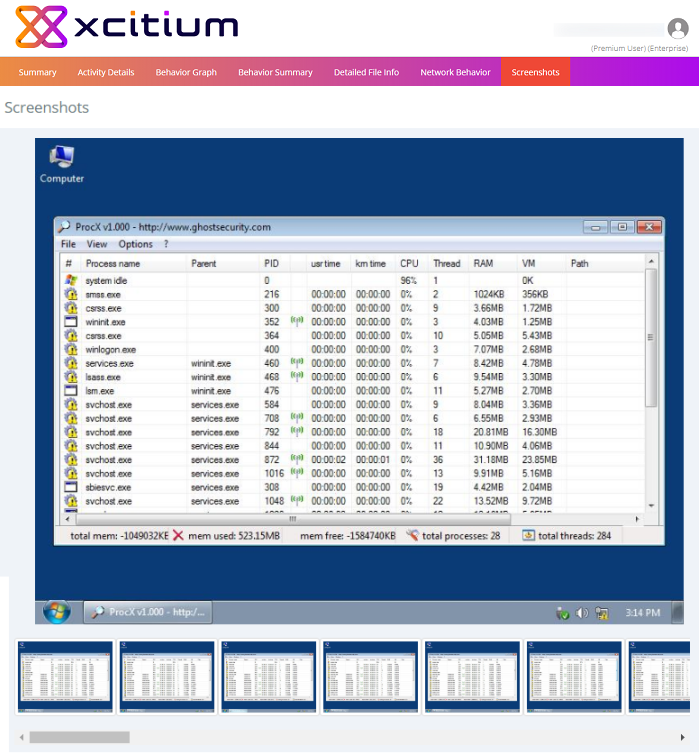
Shows screenshots of suspicious actions taken by the malware when it was running on the Verdict test servers.
Download a Kill Chain report
Click 'Download Kill Chain Report' to get a pdf version of the report:
It will open the PDF file in a new window.
