Comodo Help
Find the desired product help
Comodo Dome Firewall

Comodo Dome Firewall

Dome Cloud Firewall Admin Guide

English

Print Help Download Help
View Dome Cloud Firewall Status > System Usage Summaries
  • Introduction To Dome Cloud Firewall
    • Login To The Dome Cloud Firewall Module
    • Get Started
  • The Dashboard
  • The Main Interface
  • View And Modify System Status And General Configuration
    • Configure GUI Settings
    • View And Update DCF Version
    • Create And Schedule Backup Of DCF State
      • Manually Create A Backup
      • Schedule Backup Operations
      • Encrypt Backup Archives
      • Export A Backup
      • Import A Backup Archive From A Local Computer
      • Roll Back DCF Sate To A Previous Time Point
      • Reset DFS State To Factory Defaults
  • View Dome Cloud Firewall Status
    • System Status
    • Network Status
    • System Usage Summaries
    • Network Traffic
    • Network Connections
    • SSLVPN Connections
  • Network Configuration
  • Configure ICAP Services
  • Manage Firewall Configuration
    • Firewall Objects
      • Manage Firewall Address Objects
      • Manage Firewall Object Groups
      • Manage Firewall Schedules
      • Active Directory Integration
    • Source Network Address Translation
    • Configure Virtual IP For Destination Network Address Translation
    • Configure System Access
    • Configure Firewall Policy Rules
      • Manage Firewall Policy Rules
      • Manage VPN Firewall Rules
  • Configure HTTPS Proxy Services
  • Configure Virtual Private Network Settings
    • SSL VPN Server
      • Configure General SSL VPN Server Settings
      • Manage SSL VPN Client Accounts
      • Configure Advanced SSL VPN Server Settings
      • Configure LDAP Server Settings
      • Configure Clients To Connect To Dome Cloud Firewall
    • SSLVPN Client
    • IPSec Configuration
    • L2TP Server Configuration
    • IPsec / L2TP Users Configuration
  • View Logs
    • Realtime Logs
    • Configure Log Settings
  • About Comodo Security Solutions

System Usage Summaries


 The 'System Graphs' screen shows resource usage for the past 24 hours. This includes CPU, system memory, swap memory and disk drive use.


To open the interface, click 'Status' on the left then 'System Graphs':


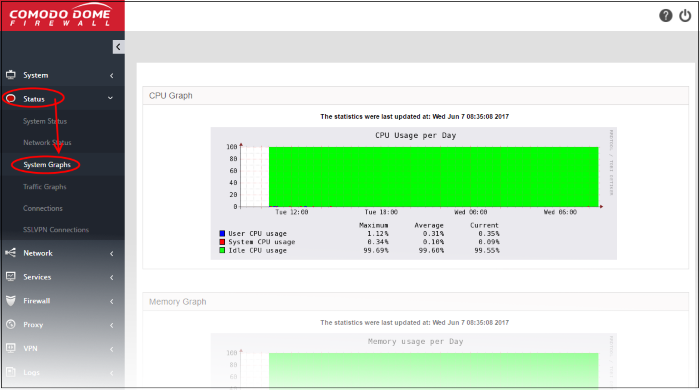
Clicking any graph will show more information about that component. Click the following links for details on each:

  • CPU Graph
  • Memory Graph
  • Swap Graph
  • Disk Graph

CPU Graph


The 'CPU Graph' displays the load on the DFS server CPU over the past 24 hours. Processes are indicated with different colors.

  • Green - Idle, CPU was not used by any of the processes
  • Blue - User initiated processes, run with default priority
  • Red - System processes


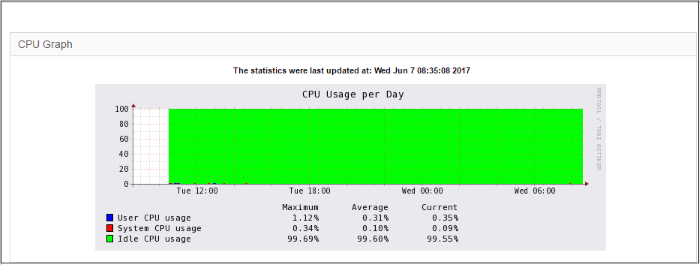
The table below the graph shows the maximum, average and current load of the CPU for the past day from various processes. Clicking the graph opens a new page with detailed CPU usage history graphs for the past day, week, month and year.


Memory Graph


The 'Memory Graph' shows memory usage over the past 24 hours. The different types of memory are indicated with different colors.

  • Blue - Memory used by running processes
  • Red - Memory shared by concurrently running processes
  • Pink - Buffered memory space used for temporarily storing data received from or sent to external devices
  • Yellow - Cached memory, used for storing recent data used by running processes
  • Green - Free, unallocated memory


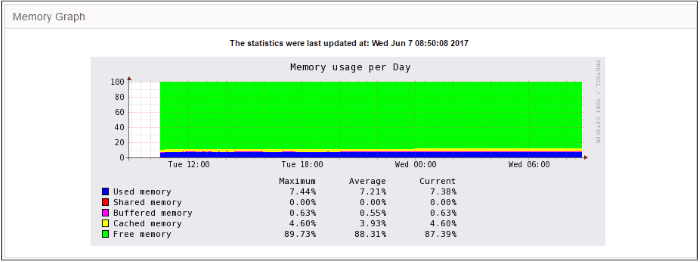
The table below the graph shows statistics of maximum, average and current usage of system memory for the past day. Clicking the graph opens a new page with detailed memory usage history graphs for the past day, week, month and year.


Swap Graph


The 'Swap Graph' shows the usage of the swap area in the hard disk, used for storing data from inactive processes, from the system memory. Different types of swap spaces are indicated with different colors.

  • Blue - Used swap space
  • Green - Free swap space


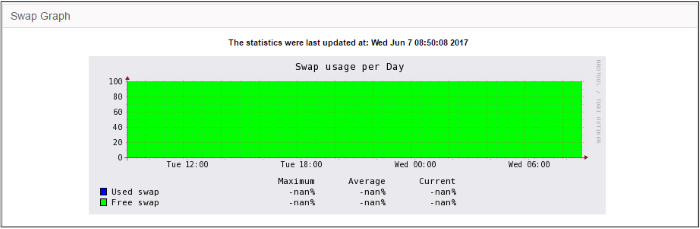
The table below the graph shows statistics of maximum, average and current usage of swap space for the past day. Clicking the graph opens a new page with detailed usage history graphs for the past day, week, month and year.


Disk Graph


The 'Disk Graph' shows disk access levels over the past two days.


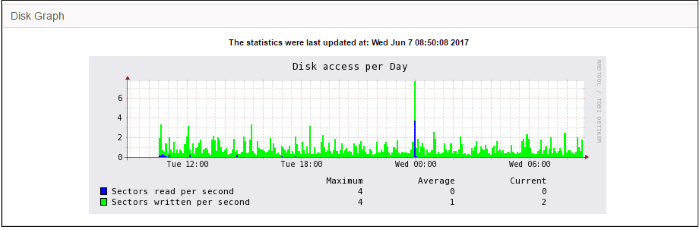
  • Green - Percentage of sectors accessed for writing into the disk
  • Blue - Percentage of sectors accessed for reading from the disk

The table below the graph shows maximum access, average access and current usage of the disk space over he past two days. Clicking the graph opens a new page with detailed access history graphs for the past day, week, month and year.

Our Products
  • Free Antivirus
  • Free Internet Security
  • Website Malware Removal
  • Free Anti-Malware
  • Anti-Spam (Free Trial)
  • Windows Antivirus
  • Antivirus for Windows 7
  • Antivirus for Windows 8
  • Antivirus for Windows 10
  • Antivirus for MAC
  • Antivirus for Linux
  • Free Endpoint Security
  • Free ModSecurity
  • Free RMM
  • Free Website Malware Scanner
  • Free Device Manager for Android
  • Free Demo
  • Network Security
  • Endpoint Protection
  • Antivirus for Android
  • Comodo Antivirus
  • Wordpress Security
Cheap CDN
  • Bootstrap CDN
  • Semantic UI CDN
  • Jquery CDN
  • CDN Plans
  • CDN
  • Free CDN
Enterprise
  • Patch Management Software
  • Patch Manager
  • Service Desk
  • Website Down
  • Endpoint Protection Solutions
  • Website Security Check
  • Remote Monitoring and Management
  • Website Security
  • Device Manager
  • ITSM
  • CRM
  • MSP
  • Android Device Manager
  • MDR Services
  • Managed IT Support Services
  • Free EDR
Free SSL Certificate
Support Partners Terms and Conditions Privacy Policy

© Comodo Group, Inc. 2025. All rights reserved.