


SNMP Device Details Interface
-
The device details page lets you view an SNMP device's hardware and software, profiles, and event logs.
-
You can also manage profiles, remove it from the managed list, rename device's name and delete the device.
Open SNMP Device Details
-
Click 'Assets' > 'Network Management' > 'Devices'
-
Click the 'Managed Devices' tab if not already open
Select a group to view managed SNMP devices assigned to that group
Or
Select 'Show all' to view every managed SNMP device
-
Click the name of any SNMP device to view its details:
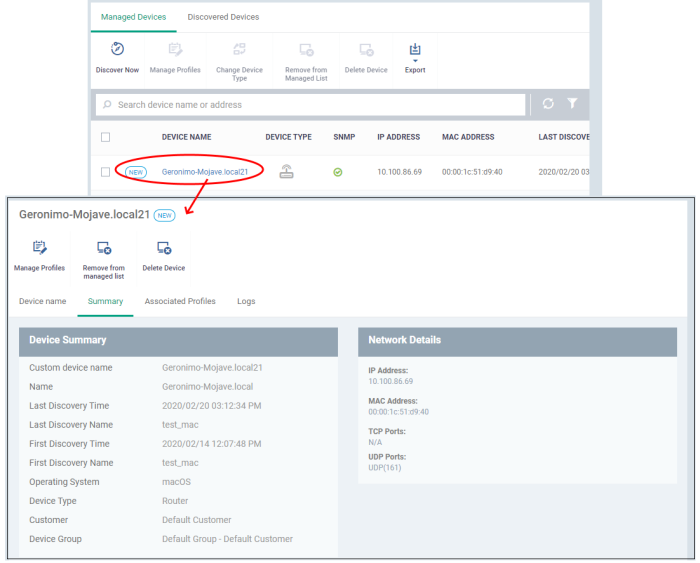
The details screen contains four tabs:
-
Device name - The label of the device
-
Summary - General hardware and network details.
-
Associated Profiles - Network profiles deployed on the device.
-
Logs - Device event logs
The buttons above the table let you perform various tasks:
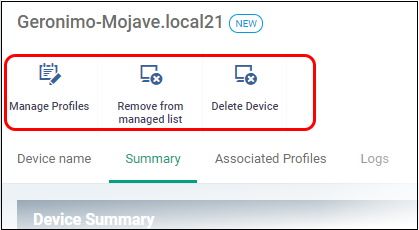
-
Manage Profiles - Add / remove network profiles to / from the SNMP device. See Deploy Profile on SNMP Device
-
Remove from managed list - The device is moved back to the 'Discovered Devices' section.. See Move SNMP Devices to Discovered Devices
-
Delete Device - The SNMP device is removed from the list. See Remove SNMP Devices
The device name page lets you change the device name to more recognizable one, if required. For example, as 'Admin department printer' for easy identification.
-
Click 'Assets' > 'Network Management' > 'Devices'
-
Click the 'Managed Devices' tab if not already open
Select a group to view managed SNMP devices assigned to that group
Or
Select 'Show all' to view every managed SNMP device
-
Click the name of any SNMP device to open its details pane and click 'Device name' tab:
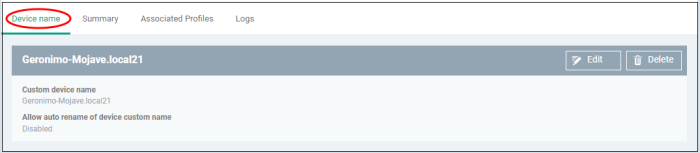
Custom device name - The current name of the device.
Allow auto rename of device custom name - Indicates whether the actual device name will automatically replace any custom name during the next sync.
-
To change the name of the device, click the 'Edit' button at the right.
-
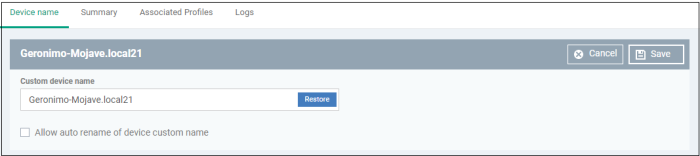
Enter the new name in the 'Custom Device Name' field
-
Make sure the 'Allow Auto Rename of Device Custom Name' is disabled to retain the custom name in the list. If this is enabled, the custom name will be automatically replaced with the device's name or model number during the next sync with the Xcitium Enterprise communication client on the probe device that monitors this device.
-
Click 'Save' for your changes to take effect.
The device is listed with its new name.
-
To restore the name of the device as it was at the time of enrollment, click 'Edit' from the 'Device Name' interface, click 'Restore' at the right and click 'Save'.
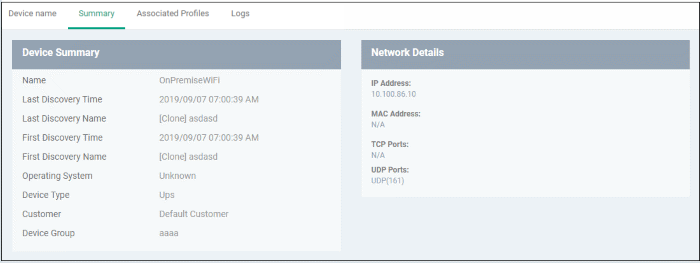
The
summary page contains general information about the device. This
includes IP / MAC address, discovery times, and device type.
-
Click 'Assets' > 'Network Management' > 'Devices'
-
Click the 'Managed Devices' tab if not already open
Select a group to view managed SNMP devices assigned to that group
Or
Select 'Show all' to view every managed SNMP device
-
Click the name of any SNMP device to open its details pane:
Manage Profiles Associated with the Device
The profile tab shows all profiles which have been applied to the device. Profiles contain monitors which track events on the device and alert you when certain conditions are met. For example, you can set up a monitor to alert you if a device has been switched off for a certain length of time.
-
Click 'Assets' > 'Network Management' > 'Devices'
-
Click the 'Managed Devices' tab if not already open
Select a group to view managed SNMP devices assigned to that group
Or
Select 'Show all' to view every managed SNMP device
-
Click the name of any SNMP device to open its details pane
-
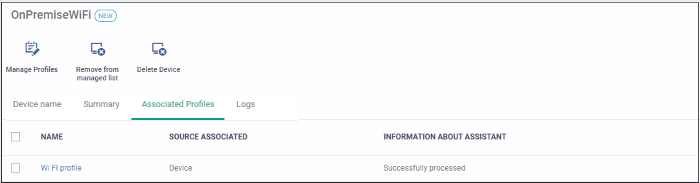
Click 'Associated Profiles':
|
Column Heading |
Description |
|---|---|
|
Name |
Label of the profile.
|
|
Source Associated |
The type of object to which the profile is applied. This column will always say 'Device' for SNMP profiles. |
|
Information about Association |
The current status of profile deployment. For example, successfully processed, deployment failed, etc. |
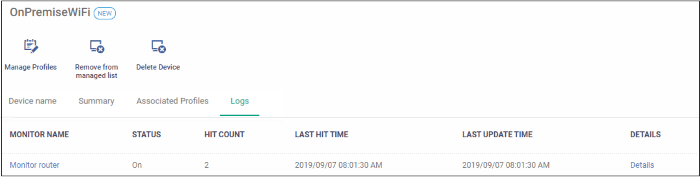
The logs tab shows all activity
on a specific SNMP device.
-
Click 'Assets' > 'Network Management' > 'Devices'
-
Click the 'Managed Devices' tab if not already open
Select a group to view managed SNMP devices assigned to that group
Or
Select 'Show all' to view every managed SNMP device
-
Click the name of any SNMP device to open its details pane then click 'Logs' tab
|
Column Heading |
Description |
|---|---|
|
Monitor Name |
The monitor that recorded the event.
|
|
Status |
Whether or not the monitor is currently active on the device |
|
Hit Count |
Number of times the monitor's conditions have been triggered. |
|
Last Hit Time |
Date and time the monitor's conditions were most recently triggered. |
|
Last Update Time |
Date and time when the information was last refreshed |
|
Details |
|