

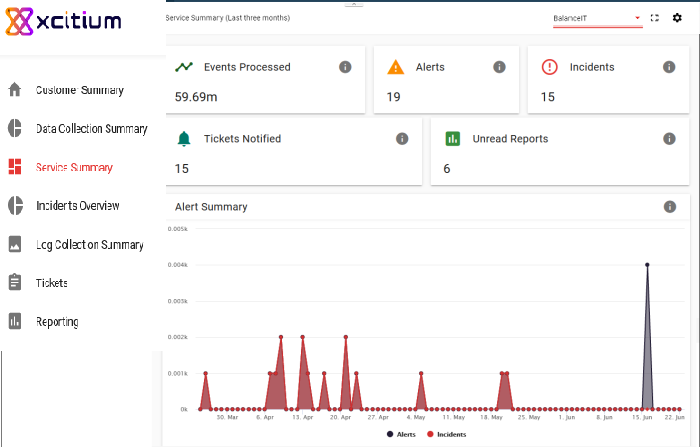
Service Summary
The service summary shows the total number of event queries processed, the number of alerts and threats, and more.
- Select a customer at top-right or click the customer name on the home screen tile.
- You can also click 'Service Summary' in the left-menu

The
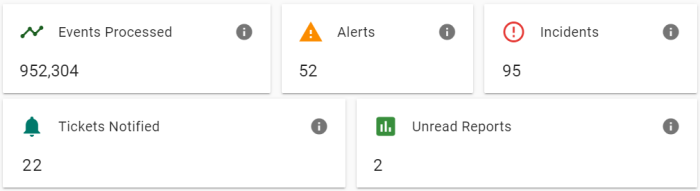
tiles along the top show:
- The number of events processed
- The number of alerts generated
- The number of incidents minus false-positives
- The number of incidents closed by the SOC team with notifications sent to customers
- The number of unread reports.
Data is provided for the past 90 days.
Events Processed
The number of events in the last 90 days.
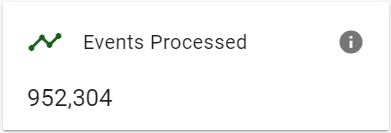
- Click the tile to open the log collection summary screen where you can view the events in detail.
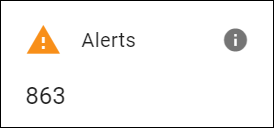
Alerts
The number of events that matched a rule and created an alert.
Incidents
The total number of alerts (incidents) minus false-positives for the last 90 days.
- Click the tile to open the incidents screen where you can analyze the incidents.
Notifications
The number of notifications sent to customers after the SOC team closed an incident
- Click the tile to open the tickets section
Unread Reports
The number of reports that the customer is yet to download and view.
- Click the tile to open the reports section
Alert Summary
Shows alerts versus actual incidents (alerts minus false-positives). Data is for the last 3 months.
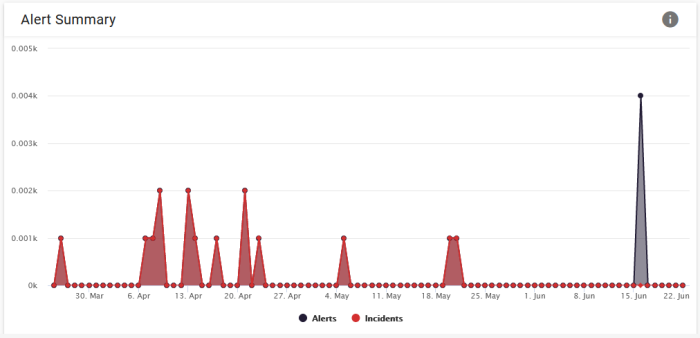
- Click the 'Alerts' or 'Incidents' text at the bottom to remove that particular graph. Click on it again to view.
- Place your mouse over a particular day to view more details for that day.