


The Dashboard
The dashboard provides an 'at-a-glance' summary of the protection status of your networks.
- Using a range of statistics and charts, the dashboard clearly displays vital information about your policy deployment and allows you to drill-down to further areas of interest or concern.
- Charts include general web browsing trends, security trends, top URL categories, top visited domains, top blocked domains, top blocked users and more.
- You can also create your own dashboard tiles tailored to your requirements.
The dashboard contains two sections:
- Web Overview – Categorized statistics about activity on your protected domains. Includes top targets/blocked domains, top users/blocked users, top countries/blocked countries and more.
- Security Overview – Statistics about security trends, top malicious sites that were blocked and more.
-
To open the 'Web Overview' section, click 'Dashboard' at the top, then 'Web Overview' under 'Dashboard' on the left.
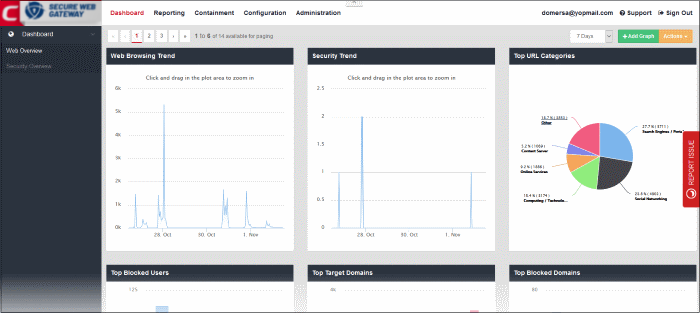
By default, the 'Web Overview' section in the dashboard displays the following tiles:
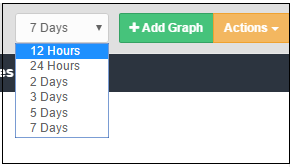
By default, statistics are displayed for the past 12 hours. You can view statistics going back up to 7 days in the drop-down at top-right:
- Add Graph - Add more tiles according to your requirements. For example, you may want to add a tile to view only blocked traffic stats and so on. See 'Customize the Dashboard' for more details.
- Actions - Make notes, place tiles in a different order and export the dashboard to pdf. Click
here for more details.
The 'Web Browsing Trend' line chart displays the number of websites visited and their HTTP requests for a particular date and time. The X-axis displays the date/time and the Y-axis displays the number of websites. The results are displayed for the latest 5 events. Placing the mouse cursor over a point will display further details.
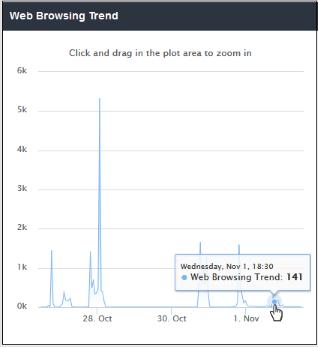
- To view full details for a particular period
in the chart, click and drag to zoom the plot. Click 'Reset Zoom' to
return to full chart. Clicking on a particular point on the chart
will open the 'View Logs' screen displaying full details of the
visited websites and HTTP requests. You can filter the details
according to your needs. See
'Viewing Web Overview Dashboard Logs'
for more details.
The 'Security Trend' tile shows sites from which malicious files were blocked. The X-axis displays the date/time of the event and the Y-axis displays the number of blocked files. The results are displayed for the latest 5 events. Placing the mouse cursor over a point will display further details.
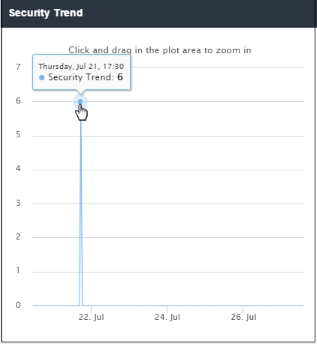
- To view full details for a particular period
in the chart, click and drag to zoom the plot. Click 'Reset Zoom' to
return to full chart. Clicking on a particular point on the chart
will open the 'View Logs' screen displaying full details of the
websites, blocked file names, file hash and signature. You can
filter the details according to your needs. See
'Viewing Web Overview Dashboard Logs'
for more details.
The 'Top URL Categories' chart displays the most visited websites in each category. The results are displayed for the top 10 categories. Placing your mouse cursor over a sector will display further details.
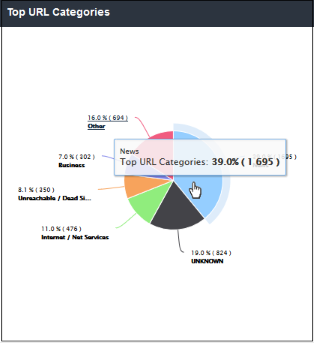
- Clicking on a particular sector on the chart
will open the 'View Logs' screen which displays full details of
visited websites and HTTP requests by category. You can filter
details according to your needs. See 'Viewing Web Overview Dashboard Logs' for more details.
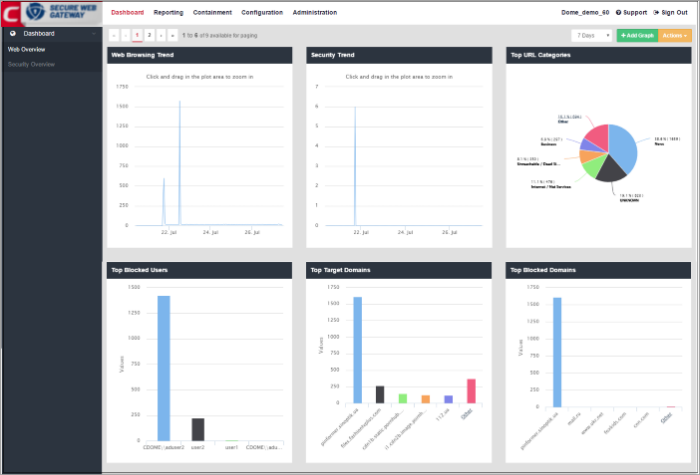
'Top Blocked Users' shows those users in the network that were most often blocked by SWG security policies. The results are displayed for the top 10 users. The X-axis displays the name of the users and the Y-axis displays the number of websites that were blocked including their HTTP requests. Placing the mouse cursor over a bar will display further details.
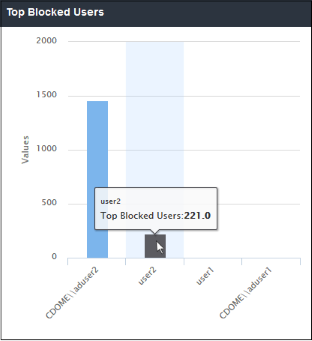
- Clicking a particular bar on the chart will
open the 'View Logs' screen displaying full details of the top
blocked users and websites including HTTP requests. You can filter
the details according to your needs. See 'Viewing Web Overview Dashboard Logs' for more details.
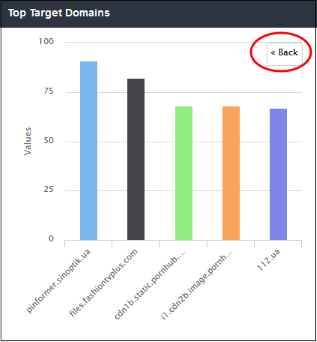
'Top Target Domains' shows those websites which were most often visited by users in your organization. The results are displayed for the top 10 domains. The X-axis displays the name of the domain and the Y-axis displays the number of times the websites were visited, including their HTTP requests. Placing your mouse cursor over a bar will display further details.
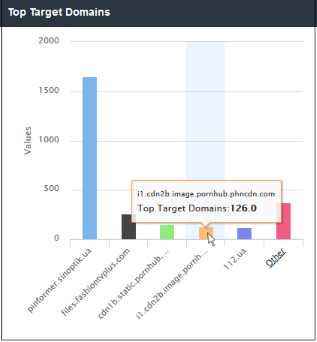
- The number of domains shown is limited 5 in the chart. Details of other 5 domains can be viewed by clicking 'Other'. Click 'Back' to return to the original view.
- Clicking on a particular bar on the chart will
open the 'View Logs' screen displaying full details of the top
visited domains and HTTP requests. You can filter the details
according to your needs. See 'Viewing Web Overview Dashboard Logs' for more details.
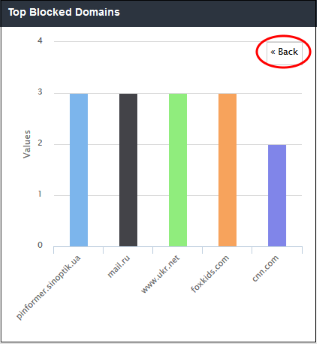
'Top Blocked Domains' shows those websites that were most often blocked by SWG security policies. The results are displayed for the top 10 blocked domains. The X-axis displays the name of the domain and the Y-axis displays the number of times the websites were blocked including their HTTP requests. Placing the mouse cursor over a bar will display further details.
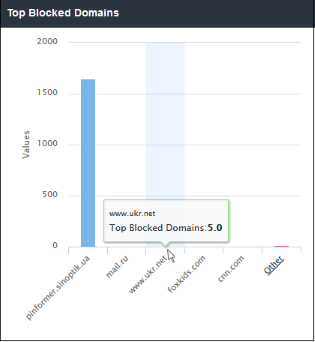
- The number of domains shown is limited to 5 in the chart. Details of the next 5 domains can be viewed by clicking the 'Other' link. Click 'Back' to return to the original view.
- Clicking a particular bar on the chart will
open the 'View Logs' screen displaying full details of the top
blocked domains and HTTP requests. You can filter the details
according to your needs. See 'Viewing Web Overview Dashboard Logs' for more details.
'Top Countries' shows the details of countries from where the most websites are hosted. The results are displayed for the top 10 countries. The X-axis displays the name of the country and the Y-axis displays the number of websites, including their HTTP requests. Placing the mouse cursor over a bar will display further details.
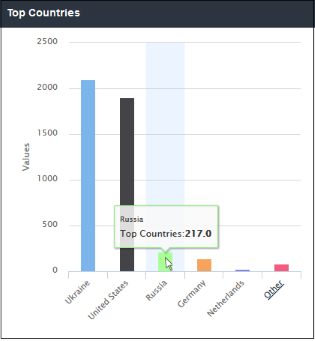
- The number of countries shown is limited to 5 in the chart. Details of the next 5 countries can be viewed by clicking the 'Other' link. Click 'Back' to return to the original view.
- Clicking a particular bar on the chart will
open the 'View Logs' screen displaying full details of the top
countries. You can filter the details according to your needs. See 'Viewing Web Overview Dashboard Logs' for more details.
'Top Blocked Countries' shows the details of countries from where the most websites that were blocked by SWG security polices, are hosted. he results are displayed for the top 10 countries. The X-axis displays the name of the blocked country and the Y-axis displays the number of websites, including their HTTP requests. Placing the mouse cursor over a bar will display further details.
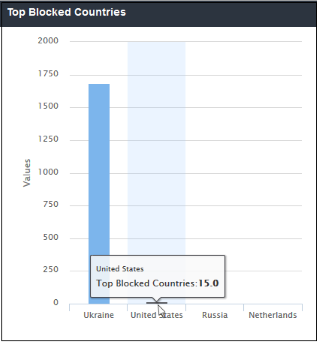
- The number of blocked countries shown is limited to 5 in the chart. Details of the next 5 countries can be viewed by clicking the 'Other' link. Click 'Back' to return to the original view.
- Clicking a particular bar on the chart will open the 'View Logs' screen displaying full details of the top blocked countries. You can filter the details according to your needs. See 'Viewing Web Overview Dashboard Logs' for more details.
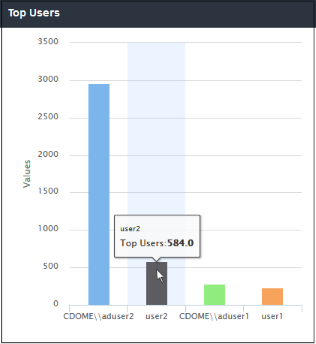
The users in your network who made the most website calls. The Y-axis value is a count of all HTTP requests made by a user. Each hit is counted separately, and each contributes to this total. This includes if the user visits different pages on the same website, or requests the same web-page multiple times. The count also includes requests made by the website itself for resources like images.
-
Click a bar in the chart to view more a full log. See 'Viewing Web Overview Dashboard Logs' if you need more help with this.
The 'Top Blocked File Types' chart displays the file types that were most blocked by SWG. The results are displayed for the top 10 categories. Placing your mouse cursor over a sector will display further details.
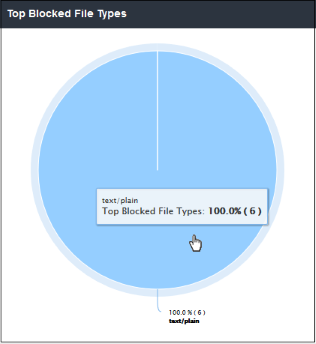
- Clicking on a particular sector on the chart will open the 'View Logs' screen which displays full details of the blocked file types. You can filter details according to your needs. See 'Viewing Web Overview Dashboard Logs' for more details.
'Most Downloaded File Types' shows the details of file types that were downloaded from websites by users in the networks in your organization. The results are displayed for the top 10 file types. The X-axis displays the name of the file type and the Y-axis displays the number of file types that were downloaded. Placing your mouse cursor over a bar will display further details.
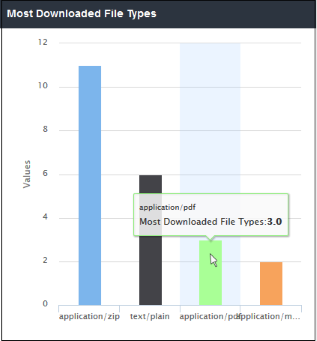
- Clicking a particular bar on the chart will open the 'View Logs' screen displaying its full details. You can filter the details according to your needs. See 'Viewing Web Overview Dashboard Logs' for more details.
- To open the 'Security Overview' section, click 'Dashboard' then 'Security Overview' on the left.
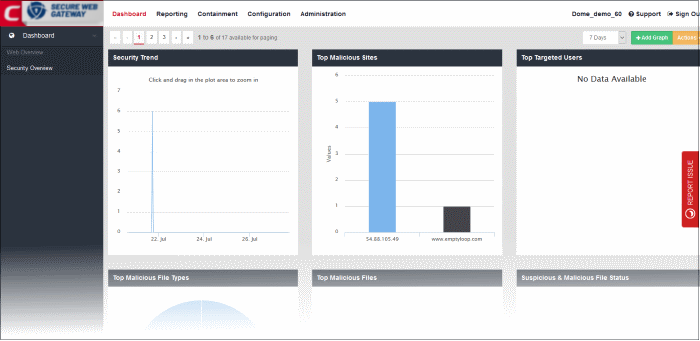
The 'Security Overview' dashboard section ships with a set of default tiles. Refer to the following for more details about each tile:
The 'Security Trend' tile shows sites from which malicious files were blocked. The X-axis displays the date/time of the event and the Y-axis displays the number of blocked files. The results are displayed for the latest 5 events. Placing the mouse cursor over a point will display further details.
- To view full details for a particular period in the chart, click and drag to zoom the plot. Click 'Reset Zoom' to return to the full chart. Clicking on a particular point on the chart will open the 'View Logs' screen displaying full details of the sites, blocked file names, file hash and signature. You can filter details according to your needs. See 'Viewing Security Overview Dashboard Logs' for more details.
'Top Malicious Sites' shows which malicious sites were most often visited. The results are displayed for the top 10 malicious sites. The X-axis displays the name / IP of the malicious website and the Y-axis displays the number of malicious files that ware blocked for each site. Placing your mouse cursor over a bar will display further details.
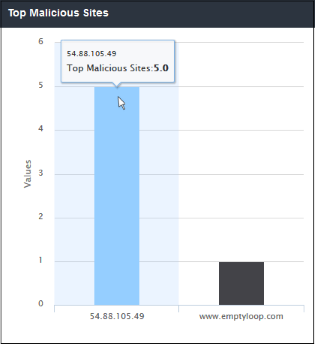
- Clicking a particular bar on the chart will
open the 'View Logs' screen displaying full details of the malicious
sites. You can filter the details according to your needs. See 'Viewing
Security Overview Dashboard Logs' for more details.
'Top Targeted Users' shows users who tried to download the highest quantities of malicious files. Placing your mouse cursor over a sector will display further details.
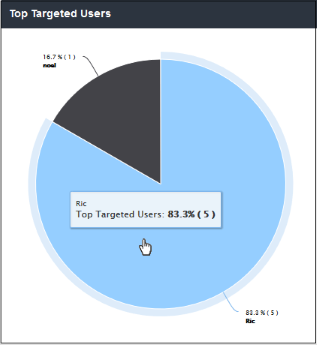
- Clicking
on a particular sector on the chart will open the 'View Logs' screen
which displays full details of the top targeted users. You can
filter details according to your needs. See 'Viewing
Security Overview Dashboard Logs' for more
details.
'Top Malicious File Types' shows which malicious file extensions were most often detected on your network.The results are displayed for the top 10 file types. Placing your mouse cursor over a sector will display further details.
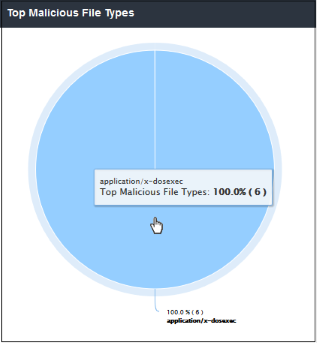
- Clicking a particular
sector on the chart will open the 'View Logs' screen
which displays more details on these files. You can filter
details according to your needs. See 'Viewing
Security Overview Dashboard Logs' for more details.
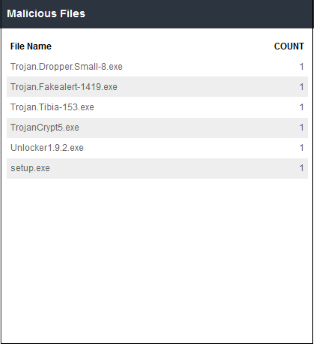
'Top Malicious Files' shows the names of those malicious files which were most often blocked by Comodo SWG. The results are displayed for the top 10 malicious files. Placing your mouse cursor over a sector will display further details.
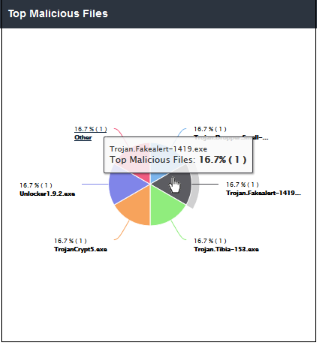
- Clicking on a particular sector on the chart
will open the 'View Logs' screen which displays full details of top
malicious files. You can filter details according to your needs. See 'Viewing
Security Overview Dashboard Logs' for more details.
Suspicious & Malicious File Status
'Suspicious & Malicious File Status' shows malicious files which were blocked and files which were classified as suspicious and therefore sandboxed.The results are displayed for the top 10 file statuses. Placing your mouse cursor over a sector will display further details.
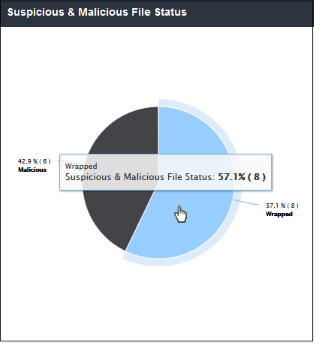
- Clicking on a particular sector on the chart
will open the 'View Logs' screen which displays the statuses of
suspicious and malicious files. You can filter details according to
your needs. See 'Viewing
Security Overview Dashboard Logs' for more details.
'Top Sandboxed Files' displays suspicious files which were most often placed in a secure sandbox environment.The results are displayed for the top 10 sandboxed files. Placing your mouse cursor over a sector will display further details.
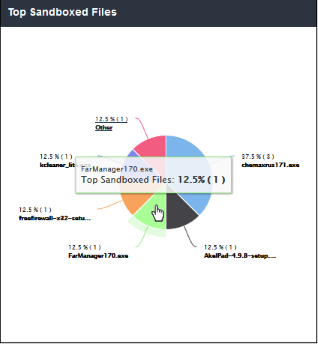
- Clicking on a particular sector on the chart will open the 'View Logs' screen which displays the details of sandboxed files. You can filter details according to your needs. See 'Viewing Security Overview Dashboard Logs' for more details.
The details displayed here is same as explained in 'Top Sandboxed Files' section, except here it is shown in tabular form for the top 50 results.
- Clicking on a particular row on the table will
open the 'View Logs' screen which displays more details about
sandboxed files. You can filter details according to your
needs. See Viewing
Security Overview Dashboard Logs' for more details.
Shows which IP's were responsible for providing the most files which had to be sandboxed. The results are displayed for the top 10 file sources. Place your mouse cursor over a bar to view more information. The X-axis displays the source details and the Y-axis displays the number of files that are placed in sandbox.
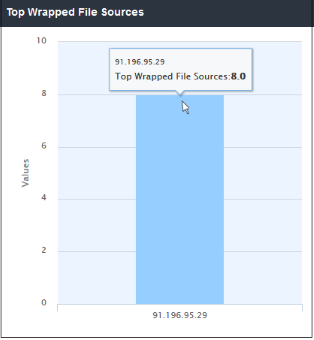
- Clicking a particular bar on the chart will
open the 'View Logs' screen displaying full details of sources from
where the suspicious were downloaded. You can filter the details
according to your needs. See 'Viewing
Security Overview Dashboard Logs' for more details.
'Executable File Downloaders' shows which users most often downloaded executable files from websites.
'Incidents Over Users' shows which users tried to download the most malicious files. This is same as the 'Top Targeted Users' tile. The results are displayed for the top 10 users. Placing your mouse cursor over a bar will display further details.
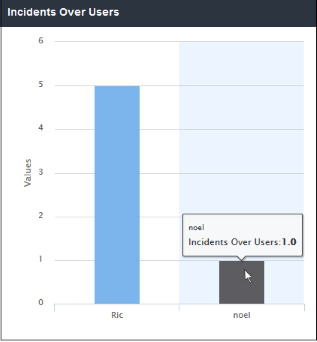
- Clicking a particular bar on the chart will open the 'View Logs' screen displaying full details of the incidents by the user such as URL of the download site, file type and so on. You can filter the details according to your needs. See 'Viewing Security Overview Dashboard Logs' for more details.
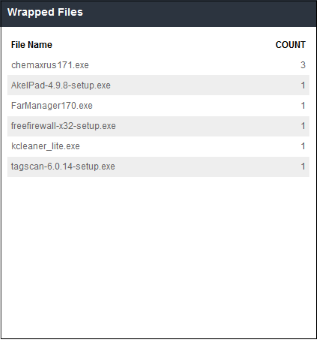
'Malicious Files' shows files that were determined as malicious and blocked by SWG. This is same as the 'Top Malicious' Files' tile, except here the details are provided in tabular form and displays results for the top 50 files.
- Clicking on a particular row on the table will
open the 'View Logs' screen which shows more
details about the malicious file. You can filter details
according to your needs. See 'Viewing
Security Overview Dashboard Logs' for more details.
'Top Malicious File Sources' shows IP's which were responsible for providing the highest quantity of blocked, malicious files. The results are displayed for the top 10 file sources. Placing your mouse cursor over a bar will display further details. The X-axis displays the source details and the Y-axis displays the number of blocked files.
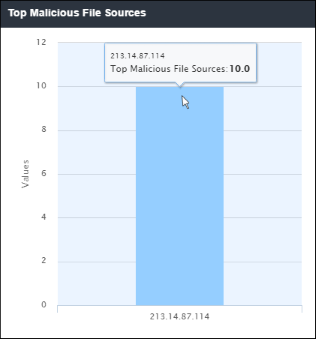
- Clicking a particular bar on the chart will
open the 'View Logs' screen displaying full details of sources from
where the malicious files were tried to be downloaded. You can
filter the details according to your needs. Refer to the section
'Viewing
Security Overview Dashboard Logs' for more details.
'Blacklisted Domains' shows the list of blacklisted domains that were added in Advanced Threat Protection settings from where users tried to download files. The table displays the results for the top 50 blacklisted domains.
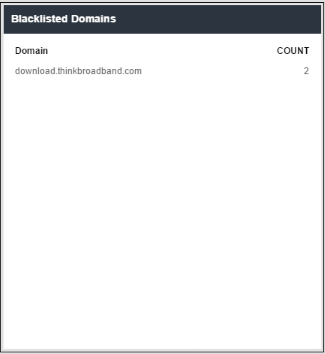
- Clicking on a particular row on the table will
open the 'View Logs' screen which displays the details of files that
were tried to be downloaded. You can filter details according to
your needs. See 'Viewing
Security Overview Dashboard Logs' for more details.
Top Blacklist Domain Access Sources
'Top Blacklist Domain Access Sources' shows the IP details of sources that most often tried to download files from blacklisted domains. The results are displayed for the top 10 access sources. Placing your mouse cursor over a bar will display further details. The X-axis displays the source details and the Y-axis displays the number of blocked files.
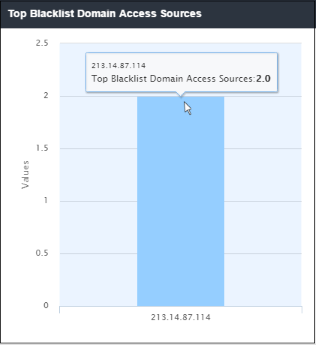
- Clicking a particular bar on the chart will
open the 'View Logs' screen displaying full details of sources from
where the files were tried to be downloaded from blacklisted
domains. You can filter the details according to your needs. See 'Viewing
Security Overview Dashboard Logs' for more details.
Suspicious
& Malicious Domains
- Domains from which users most often attempted to download suspicious or malicious files
- The table displays the results for the top 50 domains.
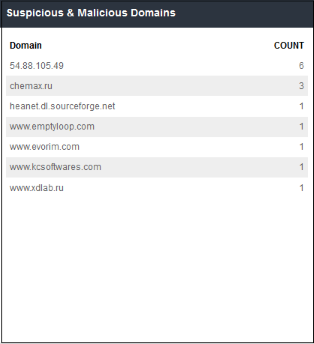
- Click
a particular row on the table to open the 'View Logs' screen. This
displays details of the files that users attempted to download. You can
filter details according to your needs. See
'Viewing
Security Overview Dashboard Logs' for more details.
Top
Suspicious & Malicious Access Sources
- The IP addresses which made the most attempts to download files from suspicious/malicious domains.
- The results are displayed for the top 10 sources. Placing your mouse cursor over a bar will display further details. The X-axis displays the source details and the Y-axis displays the number of blocked files.
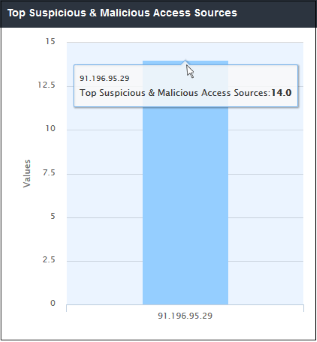
- Clicking a particular bar on the chart will open the 'View Logs' screen displaying full details of sources from where the files were tried to be downloaded from suspicious/malicious domains. You can filter the details according to your needs. See 'Viewing Security Overview Dashboard Logs' for more details.
View Web Overview Dashboard Logs
- Click a segment or bar in Web Overview dashboard chart to view more detailed information about the respective activity.
|
View Web Overview Dashboard Logs - Table of Column Descriptions |
|
|---|---|
|
Column Header |
Description |
|
Time |
Date and time the log was generated for the event. |
|
Location |
The IP of the network from which the traffic originated. |
|
Target Address |
The IP address of the destination site. |
|
Domain |
The destination domain name. |
|
URL |
The URL of the web pages of the domain including port number. |
|
Status |
Action taken by SWG, whether allowed or blocked. |
|
Message |
The reason for the action taken, for example if the web site belongs to an allowed category. |
|
User |
The name of the end user from whose endpoint the traffic originated. |
|
Country |
The name of the country where the website is hosted. |
|
Category |
The category of the website determined by SWG. |
|
Sub-category |
The sub-category of the website as determined by SWG. |
| Internal IP | The local IP of the endpoint. |
| Computer Name | The name of the endpoint from which the traffic originated. |
Selecting time interval
The log is displayed for the area at which you clicked on the graph. You can change the date and time for the log view from the 'Choose Time Interval' section.
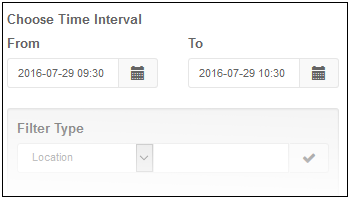
- To change the period, click the calendar icon and select the 'From' and 'To' dates or enter the period directly in the fields.
- To change the time, enter the 'From' and 'To' time in the respective fields beside the date.
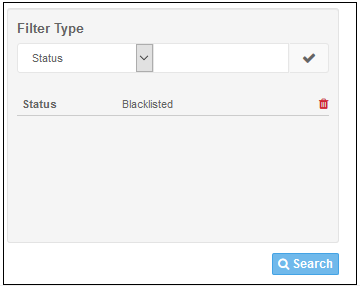
Filtering option
The 'Filter Type' section allows you to filter logs as required. You search logs by a single criteria or group them for more specific results.
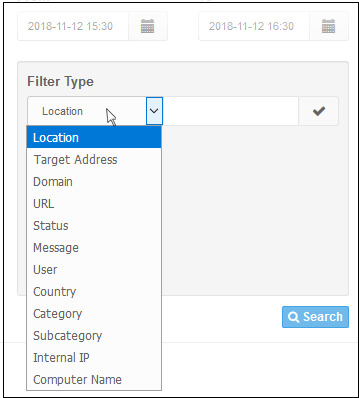
The filtering types available are: Location, Target Address, Domain, URL, Status, Message, User, Country, Category, Subcategory, Internal IP and Computer Name.
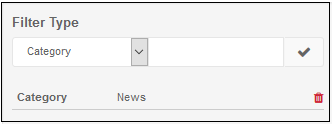
- To filter the log according to a type, select it from the 'Filter Type' drop-down, enter the relevant search text and click the check mark to run the search. The filtering type will be added and displayed.
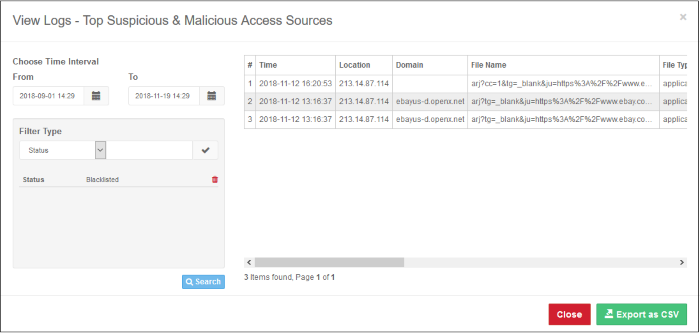
- Click the 'Search' button below to filter the log according to the entered criteria.
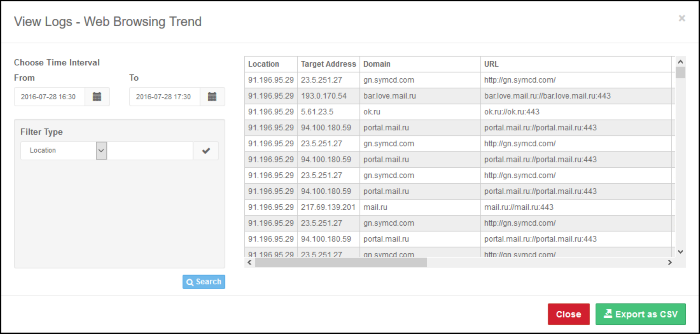
The log data for the entered filter criteria will be displayed:
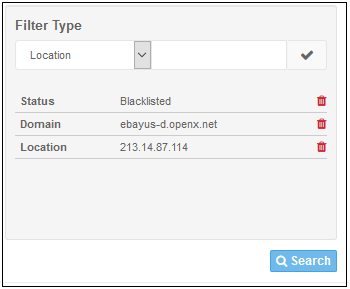
You can also group filters for more detailed search.
- To filter the log by multiple criteria, select the filtering types one by one, enter the relevant search criteria and click the check mark beside it.
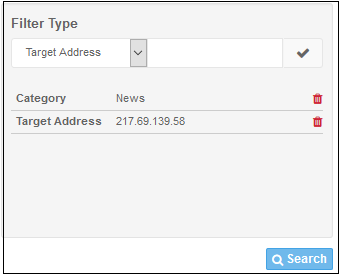
- Click the 'Search' button below to filter the log according to the entered criteria.
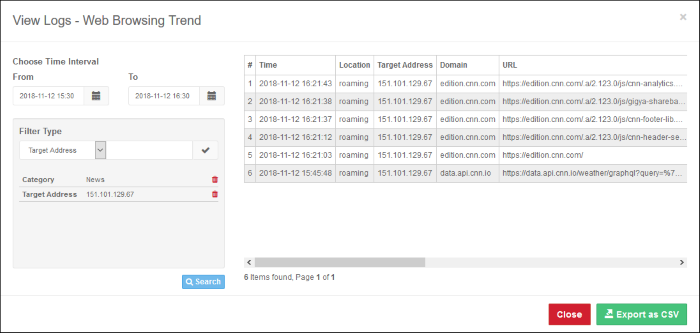
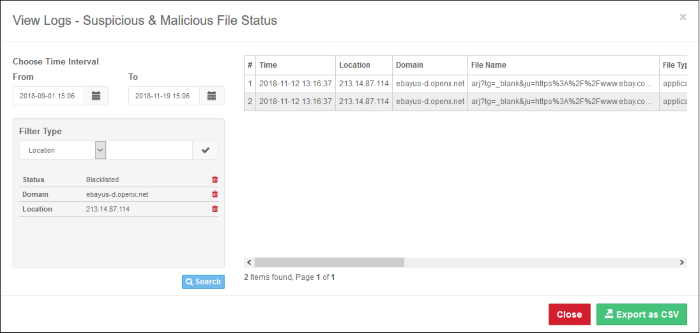
The log data for the entered filter criteria will be displayed:
- Click 'Export as CSV' to save the log in CSV format for future reference.
- To view all the entries again, delete the filter types by clicking the trash can icon beside them and clicking the 'Search' button again.
- Click 'Close' to return to 'Dashboard'
View Security Overview Dashboard Logs
- Click a segment, bar or a table row in a Security Overview dashboard chart to view more detailed information about the activity.
The log includes IP of network from which the event occurred, the domain name, file name, file type and more. The log view also allows you to choose the time period for which you want to view the logs. You can filter logs using the fields on the left. The example below shows the 'Suspicious & Malicious File Status' log:
|
View Security Overview Dashboard Logs - Table of Column Descriptions |
|
|---|---|
|
Column Header |
Description |
|
Location |
Date and time the log was generated for the event. |
|
Domain |
The destination domain name. |
|
File Name |
The name of the file that was attempted to be downloaded. |
|
File Type |
The extension type of the malicious/suspicious file. |
|
URL |
The URL of the web pages of the domain including IP details |
|
File Hash (SHA1) |
The SHA1 hash value of the file. |
|
User |
The name of the end user from whose endpoint the file was attempted to be downloaded. |
| Status | Action taken by SWG, whether blacklisted or wrapped (contained). |
| Internal IP |
The local IP address of the endpoint. |
| Computer Name |
The name of the endpoint from which the traffic originated. |
Selecting time interval
The log is displayed for the area at which you clicked on the graph. You can change the date and time for the log view from the 'Choose Time Interval' section.
- To change the period, click the calendar icon and select the 'From' and 'To' dates or enter the period directly in the fields.
- To change the time, enter the 'From' and 'To' time in the respective fields beside the date.
Filtering option
The 'Filter Type' section allows you to filter logs as required. You search logs by a single criteria or group them for more specific results.
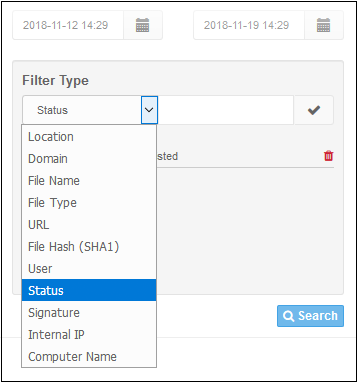
The filtering types available are: Location, Domain, File Name, File Type, URL, File Hash (SHA1), User, Status, Signature, Internal IP and Computer Name.
- To filter the log according to a type, select it from the 'Filter Type' drop-down, enter the relevant search text and click the check mark to run the search. The filtering type will be added and displayed.
- Click the 'Search' button below to filter the log according to the entered criteria.
The log data for the entered filter criteria will be displayed:
You can also group filters for more detailed search.
- To filter the log by multiple criteria, select the filtering types one by one, enter the relevant search criteria and click the check mark beside it.
- Click the 'Search' button below to filter the log according to the entered criteria.
The log data for the entered filter criteria will be displayed:
- Click 'Export as CSV' to save the log in CSV format for future reference.
- To view all the entries again, delete the filter types by clicking the trash can icon beside them and clicking the 'Search' button again.
- Click 'Close' to return to 'Dashboard'
Taking
notes, sorting and exporting
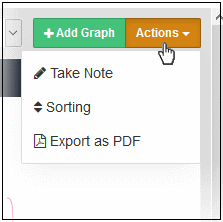
The 'Actions' button on the top right of the dashboard allows you to create notes, re-order the dashboard tile layout and export the dashboard to PDF.
- Click the 'Actions' button on the top right
Keep a note in the dashboard
- Click 'Take Note'
The 'Save Note' dialog will be displayed. You can enter a maximum of 2000 characters in the note.
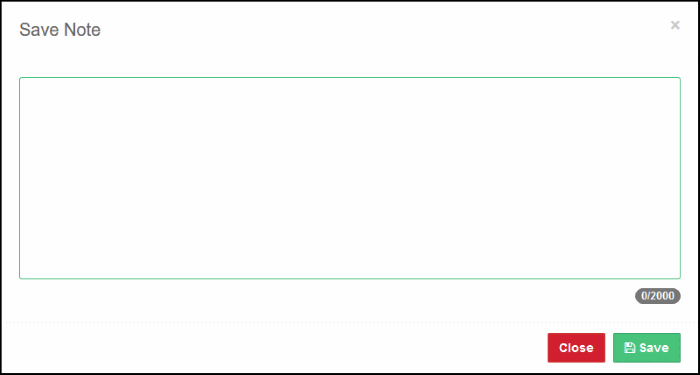
- Please note you can record only one note. After a note is saved, the drop-down for the note under 'Actions' will be displayed as 'Show Note'.
- To edit the note, click 'Show Note' under 'Actions', edit according to your requirements and click 'Save'.
- To remove a note, click 'Show Note' under 'Actions', delete the contents in the note and click 'Save'
Re-order the dashboard tile layout
- Click 'Sorting' under 'Actions'
The 'Sorting' dialog will be displayed. The tiles displayed depends on the dashboard type selected, either Web Overview or Security Overview. The following shows the Security Overview tiles.
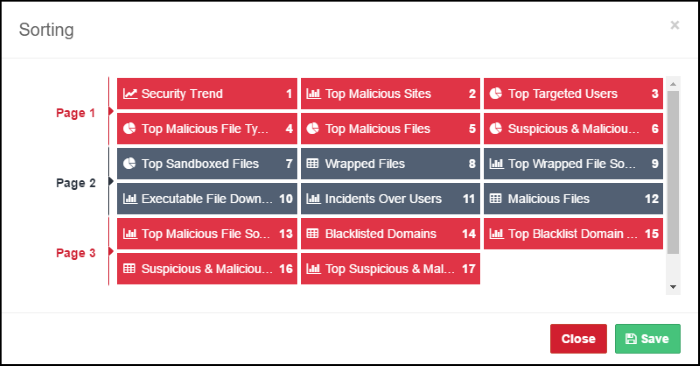
Each tile's current position is
indicated by a number at the right of each tile.
- To re-order the layout, click, drag and place the bar as per your requirements.
- Click 'Save'.
The layout of the dashboard tiles will be changed. Please note that you can also re-order the custom tiles that you have added. See 'Customize the Dashboard' to know about how to create new tiles.
Export the dashboard as PDF
- Click 'Export as PDF' under 'Actions'
The export process will be begin and the dashboard will be stored in PDF format for your future reference.