


Step 5 – Configure Event Queries
After configuring NXLog, Rsyslog and sensors as explained in Step 3, the logs will start to flow to cWatch.
- The event query area lets you search for specific events using built-in queries or custom queries.
- You create your own conditions for each search. For example, for events during a specific period in specific customer networks.
- The results table shows all events which match the query conditions. The table also lets you run a look-up on external IPs involved in the event.
Once created, an event query can also be used for:
- Custom dashboards which show the query results as charts. See 'Configure Custom Dashboard' for more details.
- Correlation rules which identify harmful events/incidents and assign them to customer admins for attention. See Manage Rules for more details.
To configure custom queries
-
Click the menu button at top-right > 'Investigation' > 'Event Query':
- Select the customer from the left pane under 'Customers' that you want to configure custom queries.
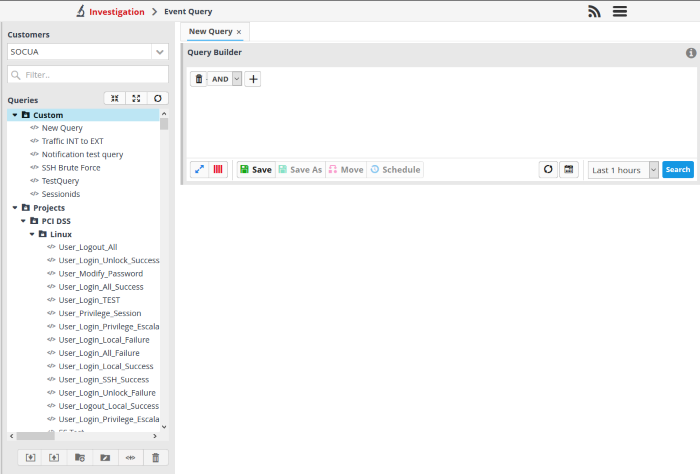
The 'New Query' tab contains a query builder which allows you to create a new query for a selected customer. Any queries you create will be added to 'Custom queries'.
The left side panel displays a list of predefined queries and custom queries for the selected customer. The predefined query folders are in blue and custom query folders are in black. Before creating a query, you have to create a folder under which the query should be saved.
-
Click the
 folder button at the bottom on the left
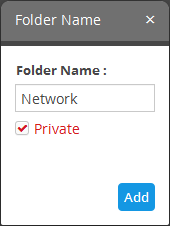
- Folder Name – Enter the name for the folder
- Private - If you select this, the folder will be accessible only to you. The folder will have a lock icon indicating it is a private folder. This option is available only while creating a top level folder.
- Click 'Add'
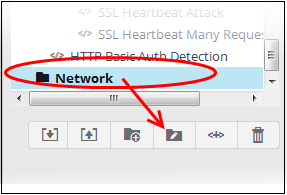
The folder will be saved and displayed on the left side. You can save an event query under this folder.
An event query is built with a set of filter statements that are connected by Boolean operators, 'AND', 'OR' or 'NOT'. Each filter contains the following components.
'Field Group' + 'Field' + 'Operator + 'Value'
- Field Group - The group to which the 'Field' specified as the filter parameter belongs.
- Field - The field in the event log entry by which you want to filter results. For example, if you choose 'Agent' field group, you can select 'agent_id' or 'agent_ip' as an event field. For full list of field groups and event fields, see 'Appendix 1 – Field Groups and Event Items Description'.
- Operator - Controls the relationship between the field and the specified value. Examples include 'Equals to', 'Does not equal to', contains, 'does not contain' and so on.
- Value - The value for the field. Values can be entered manually or fetched from a pre-defined list which is managed in the Live List Management' interface. For example, if you choose a source IP (src_ip) as the field to be searched from network events, you can manually enter the IP address of the source of the connection request or choose a Live List containing a list of specified source IP addresses.
When the query is run, events will be fetched from the database and checked against the filter statements one by one.
Examples:
-
To search for network connection events originating from an endpoint with IP address 10.100.100.100, build the filter statement as shown below:
'Source' + 'src_ip' + '=' + '10.100.100.100'
-
To search for network connection events originating from a set of endpoints whose IP addresses start with 10.100.100.xxx, build the filter statement as shown below:
'Source' + 'src_ip' + 'AB*' + '10.100.100
-
To search for network connection events originating from a set of endpoints whose IP addresses are defined in the 'Live List type' named 'Internal' under the 'Live List' named 'IP Blacklist', build the filter statement as shown below:
'Source' + 'src_ip' + '[a]' + 'IP Blacklist' + 'Internal'
You can create more complex queries by adding more filter statements and linking them using 'AND', 'OR', or 'NOT'. For example:
-
To search for network connection events originating from an endpoint with the IP 10.100.100.100, and destined for an endpoint with the IP 10.100.100.120, build the filter statements with the AND operator as shown below:
'Source' + 'src_ip' + '=' + '10.100.100.100'
AND
'Destination' + 'dst_ip' + '=' + '10.100.100.120'
- To
create a new event query under the folder, select it and click the
 button
A 'New Query' tab will be added and displayed on the right.
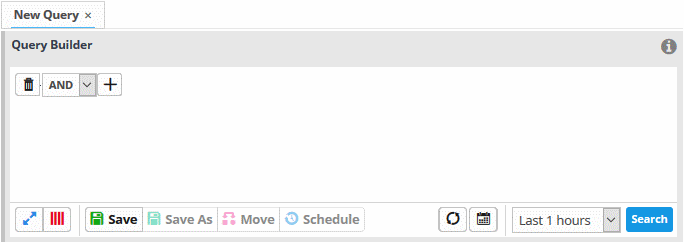
The next step is to add filters to the query.
- Choose the operator for the query filter statement from the drop-down in the 'Query Builder' pane. The options available are:
- AND
- OR
- NOT
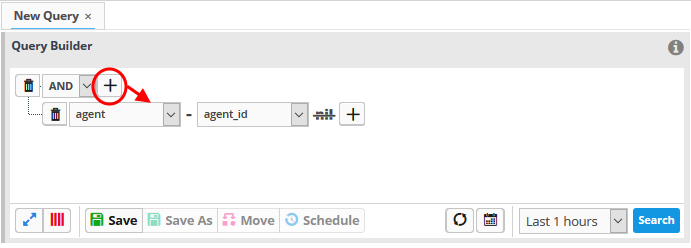
- Click
the
 button to add a filter
The 'Field Groups' drop-down and 'Fields' drop-down will appear. The 'Fields' drop-down will contain options relevant to the 'Field Group' chosen from the drop-down at the left.
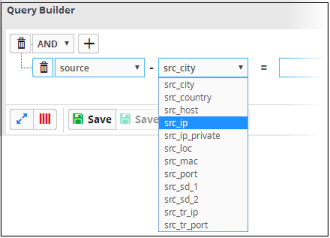
- Choose the field group you wish to add to the filter from the 'Field Groups' drop-down.
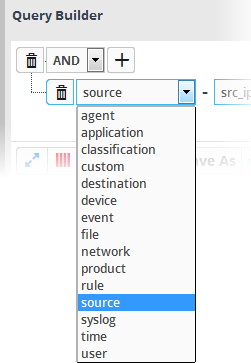
The next field will display the fields available for the selected field group.
|
Tip: Descriptions of each Field Group and the Field items under them are available in Appendix 1 - Field Groups and Event Items Description. |
The next step is to choose the relationship operator between the two fields.
- To choose an operator, click the drop-down between the two fields:
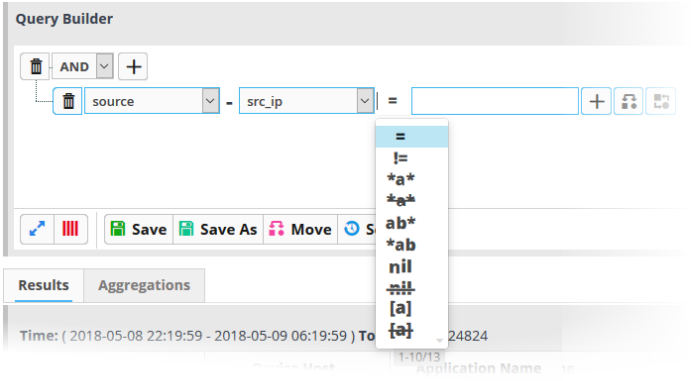
The types operators depends on the field chosen. The following table explains the various operator symbols:
|
Relation Operator |
Description |
Entering the value for the 'Field' |
|---|---|---|
 |
Equals to |
|
 |
Does not equal to |
|
 |
Greater than |
|
 |
Greater than or equal to |
|
 |
Less than |
|
 |
Less than or equal to |
|
 |
Contains |
|
 |
Does not contain |
|
 |
Starts with |
|
 |
Ends with |
|
 |
Is Empty |
|
 |
Is Not Empty |
|
 |
Is in List |
Configure the filter statement to fetch values for the field from a pre-defined list containing specific values for the field type. Background:
The first drop-down shows the Lists that contain values for the selected query field. The second drop-down shows the List Types within the selected 'List'.
|
 |
Not in List |
Allows you to configure the filter statement to search for the events that do not contain specific values from a pre-defined list. On selecting as the relation parameter, drop-down options will appear for the List and the List type: The first drop-down shows the Lists that contain values for the selected query field. The second drop-down shows the List Types within the selected 'List'.
The results will display all events that do not contain the values in the lists. |
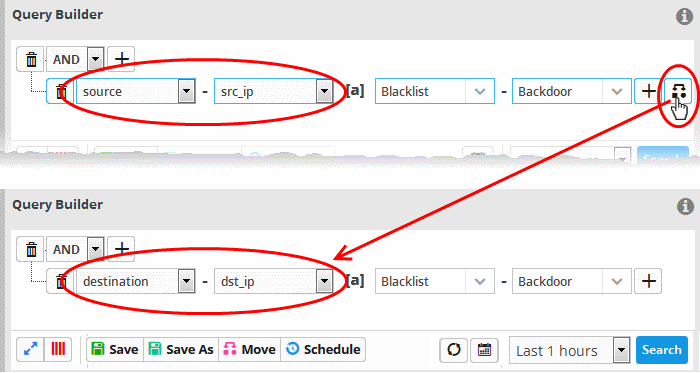
If you are adding values for source parameters like source IP address, source port, source MAC etc., but wish to reverse the parameter, click the switch icon
 that appears to
the right of the statement. The field group and the field selected
will automatically switch from source to destination or vice-versa.
that appears to
the right of the statement. The field group and the field selected
will automatically switch from source to destination or vice-versa.
-
For example, if you are specifying a live list containing values of source IPs for the source IP field, but want to change them to destination IPs, you can click the switch button.
- To
add a sub-filter statement, click the
 button beside the filter and
repeat the process.
button beside the filter and
repeat the process.
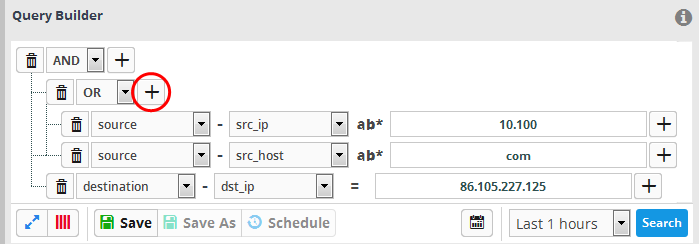
- To set the relationship between each statement, use the drop-down menu.
- For example, the query below will return events whose source ends with 10.100 OR .com AND whose destination is 86.105.227.125
|
Tip: You can update and refine a query by adding more filters once you have seen the results. |
- To
add more filter statements to the query, click the button and
repeat the process.
- To
delete a filter, click the button
 beside it.
- Click the 'Save' button in the 'Query Builder' screen.
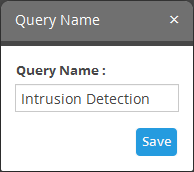
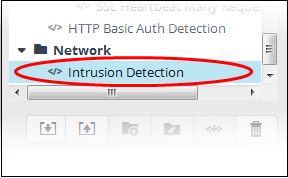
- Enter the name of the query in the 'Query Name' field and click the 'Save' button .
The 'Event Query' will be saved under the selected folder and displayed.
|
Note: If you didn't select a folder in the first step you will be asked to do so when saving the query. |
The next step is to run the event
query. Before that, however, the 'Results' table must be checked and
configured so that it is relevant to the event query. See
'Configure Results Table
for a Query' for more details.
Configure the Results Table for a Query
In order to display the event fields relevant to a specific query, the 'Results' table must first be configured.
- By default, cWatch ships with ten event field columns in the results table.
- You can add more event field columns here.
- Select
an event query from the left side and click the
 button from the
'Query Builder' pane. Note - The event field columns added to the results are valid for this search only. Go to 'Investigation' > 'Event
Field Selection Settings' to
configure fields that are valid for all query searches.
button from the
'Query Builder' pane. Note - The event field columns added to the results are valid for this search only. Go to 'Investigation' > 'Event
Field Selection Settings' to
configure fields that are valid for all query searches.
The 'Result Fields Selection' dialog will be displayed.
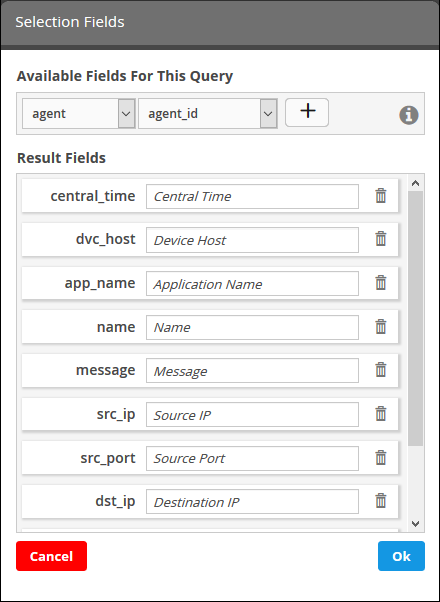
The same 'Field Groups' and 'Fields' used for in the 'Query Builder' will be available for inclusion in the results table. By default a set of 'Result Fields' relevant to the query will be displayed.
- To add new 'Result Fields', click the 'Field Groups' combo box and select the field group.
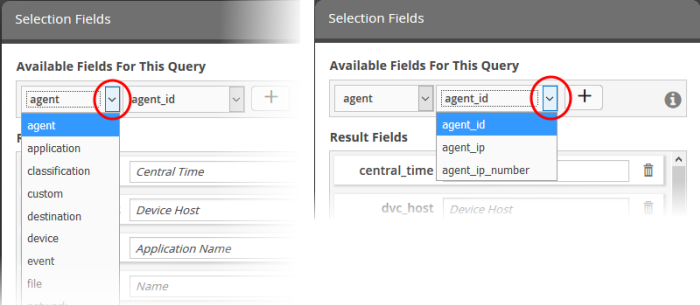
The next field will display the items available for the selected field group.
- Select
the required field from the drop-down and click the button.
A new field will be added and you may provide a new label for the result field if required.
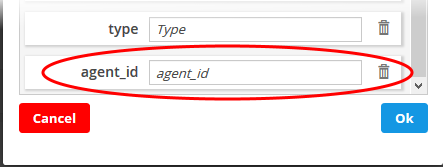
- Enter a name for the field if required, by which the field should be displayed in the 'Results' screen.
- Repeat the process to add more fields and click 'OK'
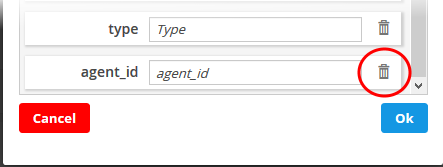
- To
remove irrelevant fields, click the trash can icon
 beside it.
- Click the 'Ok' button
- Click the 'Cancel' button to revert the changes you made.
- Click the 'Save' button in the 'Query Builder' screen to save your changes.
You can also refer to Comdo built-in event queries to have a better insight about configuring different types of queries.
Now that you have configured and saved an event query, the next step is to run it.
- Select an event query from the left.
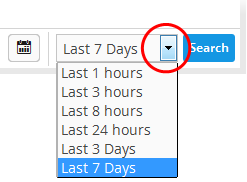
- Select the period for which you want to run the query.
- View recent events - Select a period from the drop-down at the bottom right of the 'Query Builder' pane and click 'Search'. Options range from the past hour to the past 7 days.
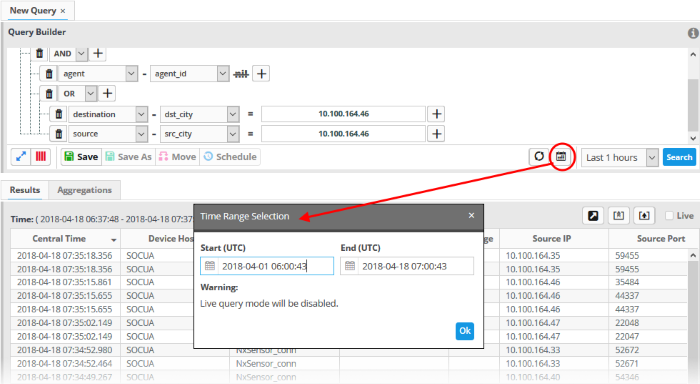
- View events over specific dates - Click the calendar button, enter the start and end dates and click 'Search'.
The 'Results' are displayed in the lower pane.
- Select the 'Live' check box to search streaming data for the event query.
|
Note: The 'Live' option is not available for searches with specific start and end dates. |
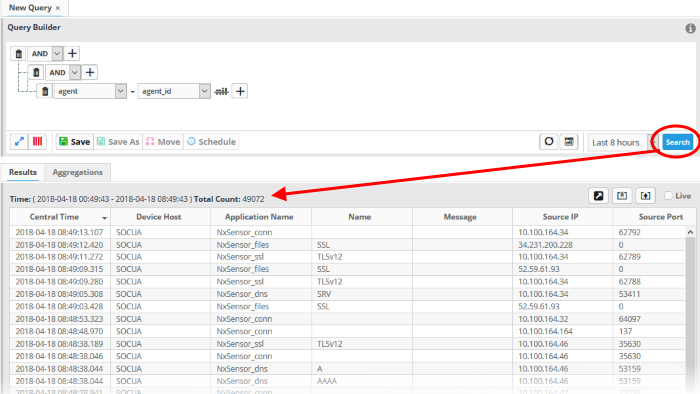
The lower pane has two tabs:
- Results - The 'Results' tab displays log entries that match the query with the selected event fields as column headers (explained above). Click on an event to view its details. More details on the 'Results Table' are available under 'View Results Table'.
- Aggregations - The Aggregations tab allows you to group identified events and view aggregation results. More details on aggregations are available under 'View Aggregated Results'.
For more details about event queries such as scheduling, viewing detailed results and aggregated results, managing a query folder and more see Configure Event Queries.
|
Tips: You can configure other features in cWatch that will help to perform a tagged search, provide value from lists and populate events from correlation and aggregation rules:
|