Comodo Help
Find the desired product help
Xcitium EDR

Xcitium EDR

Comodo EDR Quick Start Guide

English

Print Help Download Help
Comodo EDR - Quick Start > Step 9 - View Process Timeline Of Events
  • Comodo EDR - Quick Start
    • Step 1 - Login To EDR
    • Step 2 - Add Endpoints To EDR
    • Step 3 - Manage EDR Policies
    • Step 4 - View Events Details On Endpoints
    • Step 5 - View Alerts
    • Step 6 - Analyze Events
    • Step 7 - Investigate Events On Computers
    • Step 8 - Analyze Files By Their Hash Values
    • Step 9 - View Process Timeline Of Events

Step 9 - View Process Timeline of Events


The 'Process Timeline' shows all processes spawned by an event.


You can view the timeline in two ways:


Event Search

  • Go to 'Investigation' > 'Event Search', select a time-period and click 'Search'.
  • Click the timeline icon  in the 'Event List' section.
    • Alternatively, enter an event ID manually to view its timeline.

    Alerts

    • Go to 'Alerts' then click 'Show Alerts' in a row.
    • Click the timeline icon in the 'Event List' section.

    The timeline of the selected event will be shown:


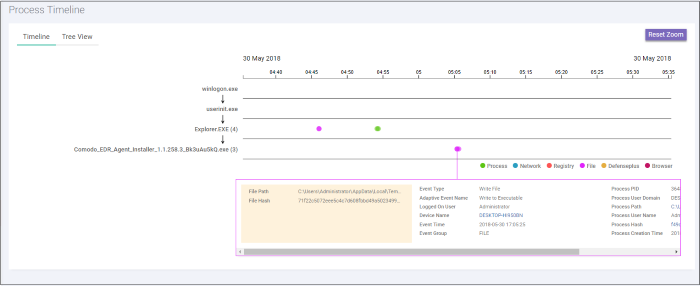
    You can view the details in timeline or tree view.


    Timeline View


    The timeline view is the default view:


    • The time-line shows processes generated by the event over time.
    • Results are shown for processes generated 30 minutes before and after the event.
    • For example, if an event started at 11.00 AM, results are shown from 10.30 AM to 11.30 AM
    • The timeline of the event is shown at the top with date and time preselected.
    • Executables opened by the event are shown by the down arrow on the left.
    • The number beside a process name shows the quantity of events created by the process.
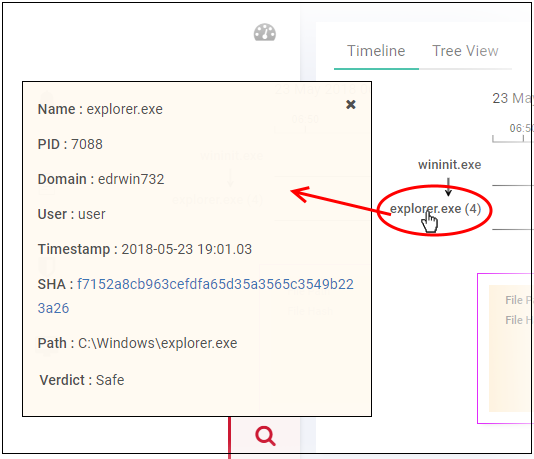
    • Click on a process to view process name, time-stamp, hash, path and verdict:


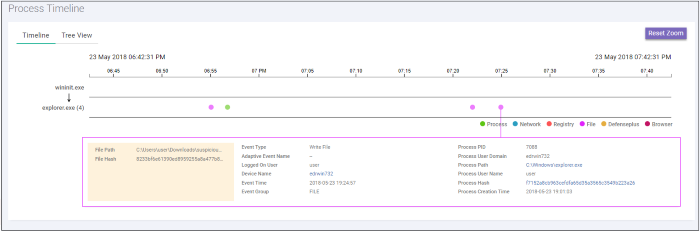
    • Details about the event (created by the process) are shown in the box below the process path.
    • The event types are color coded and displayed above the event details box.


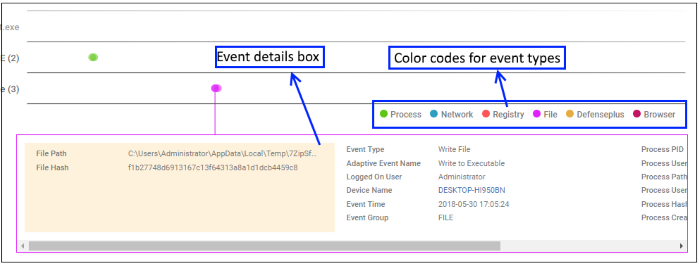
    • Event details show all event fields for that event type. The number of event fields displayed depends on the event type.

    Tree View

    • Click the 'Tree View' tab.
    • The view shows process activity as a sequence of parent/child events:


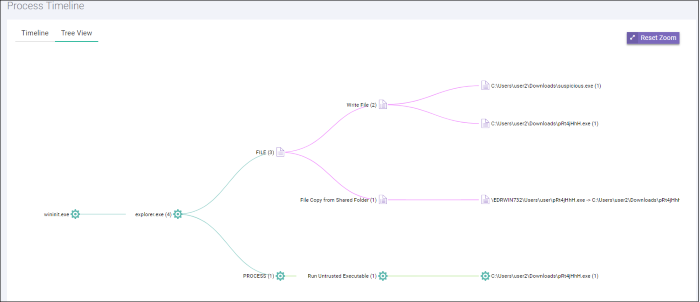
    • Use mouse to zoom in and zoom out. Click 'Reset Zoom' to default view.
    • The number beside a process name indicates the number of events generated by the process.
    • Click a process name to view full details about it in the 'Event Search' screen.
    Our Products
    • Free Antivirus
    • Free Internet Security
    • Website Malware Removal
    • Free Anti-Malware
    • Anti-Spam (Free Trial)
    • Windows Antivirus
    • Antivirus for Windows 7
    • Antivirus for Windows 8
    • Antivirus for Windows 10
    • Antivirus for MAC
    • Antivirus for Linux
    • Free Endpoint Security
    • Free ModSecurity
    • Free RMM
    • Free Website Malware Scanner
    • Free Device Manager for Android
    • Free Demo
    • Network Security
    • Endpoint Protection
    • Antivirus for Android
    • Comodo Antivirus
    • Wordpress Security
    Cheap CDN
    • Bootstrap CDN
    • Semantic UI CDN
    • Jquery CDN
    • CDN Plans
    • CDN
    • Free CDN
    Enterprise
    • Patch Management Software
    • Patch Manager
    • Service Desk
    • Website Down
    • Endpoint Protection Solutions
    • Website Security Check
    • Remote Monitoring and Management
    • Website Security
    • Device Manager
    • ITSM
    • CRM
    • MSP
    • Android Device Manager
    • MDR Services
    • Managed IT Support Services
    • Free EDR
    Free SSL Certificate
    Support Partners Terms and Conditions Privacy Policy

    © Comodo Group, Inc. 2025. All rights reserved.