

Threat Summary
The 'Threat Summary' dashboard shows attack sources, types of attack, attack origin and destination, and more.
- Click
'Incidents Overview' > 'Threat Summary' to open the interface:
- Select a customer at top-right
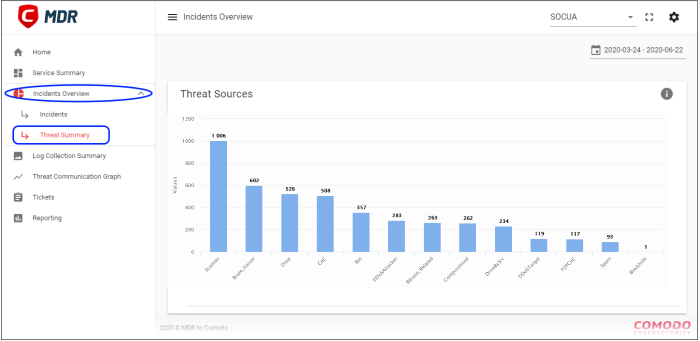
- Statistics are shown for the past seven days by default.
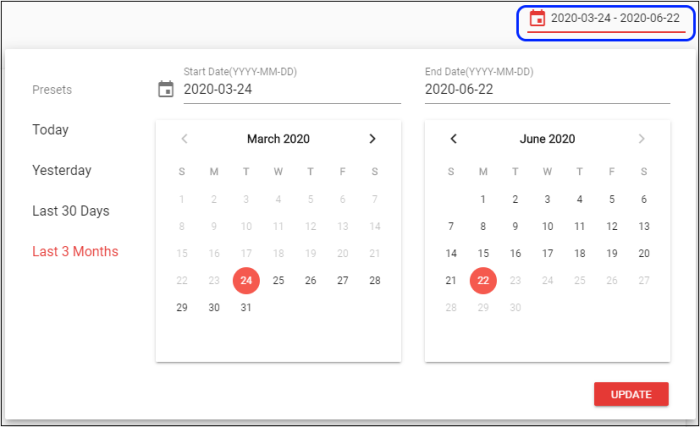
- Click the date range above the chart to change the time-period shown:
Threat Sources
Shows the types of threats that occurred over the selected time-period, and the number of sources for each:
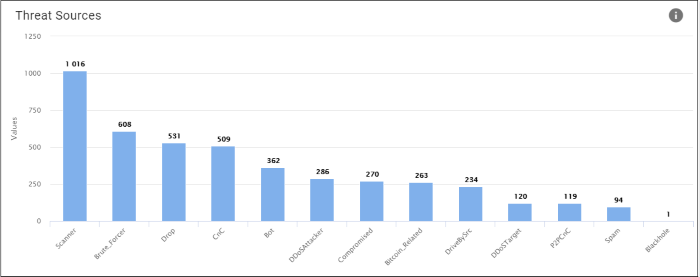
- X-axis – The name of the threat
- Y-axis – Number of sources for each threat category
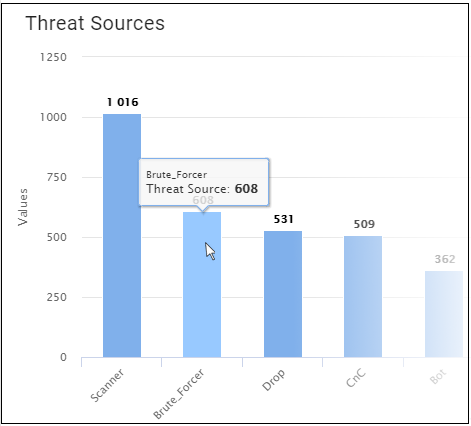
- Click a bar graph to view its details:
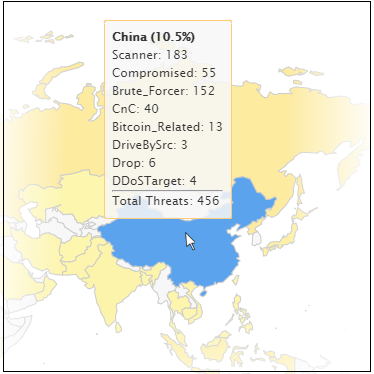
Threat Distribution Map
- A heat map of the threat sources
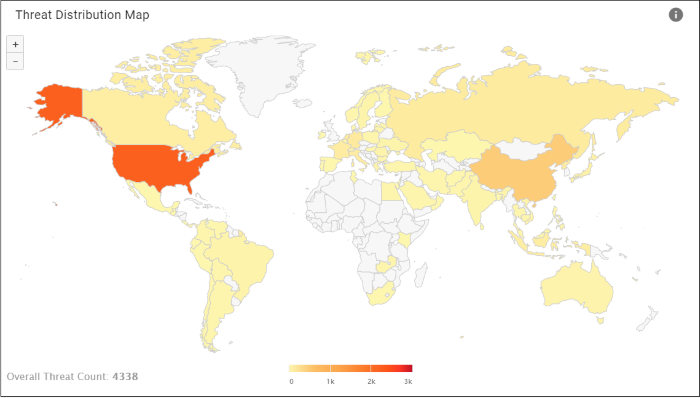
- Click a country to view details of the threat categories from that country:
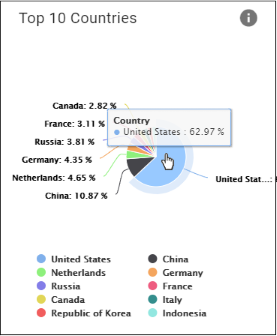
Top 10 Countries
'Top 10 Countries' shows the details of countries from where both incoming and outgoing threats were recorded. The details are shown by percentage.
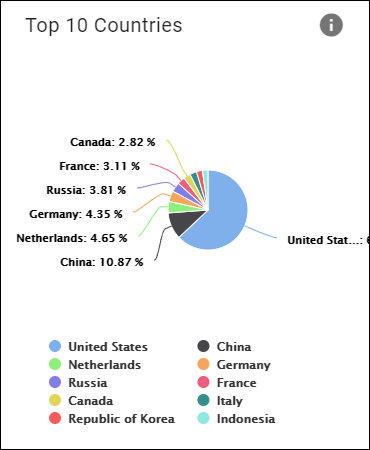
- Placing the mouse cursor over a segment will display further details.
- Click
a country legend below to enable/ disable its data. For example,
click 'China' and this segment will be removed from the pie chart.
Click the legend again to view it.
Top 10 Threat Types
This pie-chart shows the details of top ten-most incoming and outgoing threat types that were recorded.
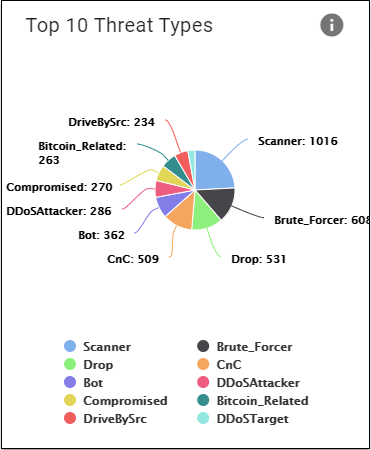
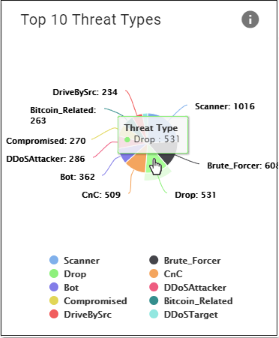
- Placing the mouse cursor over a segment will display further details.
- Click a threat name below to enable/ disable its data. For example, click 'Scanner' and this segment will be removed from the pie chart. Click the legend again to view it.
Top 10 Internal IPs
This pie chart shows the details of endpoints from which the threat types originated. The number beside an IP indicates the threat counts that originated from the endpoint.
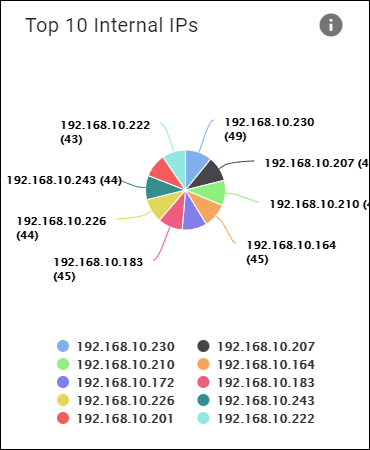
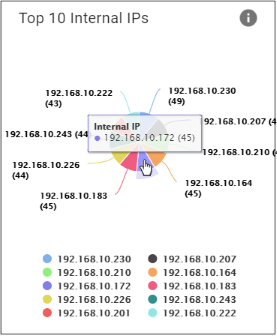
- Placing the mouse cursor over a segment will display further details.
- Click an IP to enable/ disable its data. For example, click '192.168.10.222' and this segment will be removed from the pie chart. Click the IP again to view it.