


Viewing Log Collection Summaries
Log collection summaries provide an insight into event logs collected from agents and endpoints on customer networks. Administrators can view a history of log collection and can export the summaries to .pdf for offline analysis.
To open the 'Log Collection Summary' interface, click the 'Navigational Menu' button at top right, choose 'Administration' from the options and then click 'Log Collection Summary'.
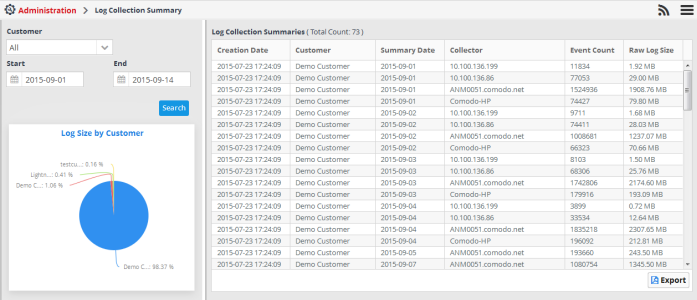
The upper pane in the left side panel allows you to select the customer and the time period for which the log collection summaries are to be viewed. The lower pane in the left panel displays a pie chart that shows the breakup of sizes of log files collected from each agent/endpoint in the selected customer's networks.
|
Log Collection Summary Interface - Table of controls |
|
|---|---|
|
|
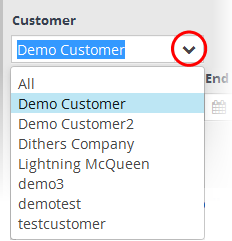
The 'Customers' drop-down allows you to select the customer for which you want to view the log collection summary. |
|
|
The 'Start' and 'End' fields allow you to define the period for which you want to view the log collection summaries for the selected customer. Use the calendar icons in the respective fields to specify the start and end dates. |
|
|
Allows to search the logs collected from the customer within the specified time period. The details of the log collection are displayed in the 'Log Collection Summaries' table at the right. |
|
|
Allows you to save the log collection summary table to a .pdf file and save it for future analysis. |


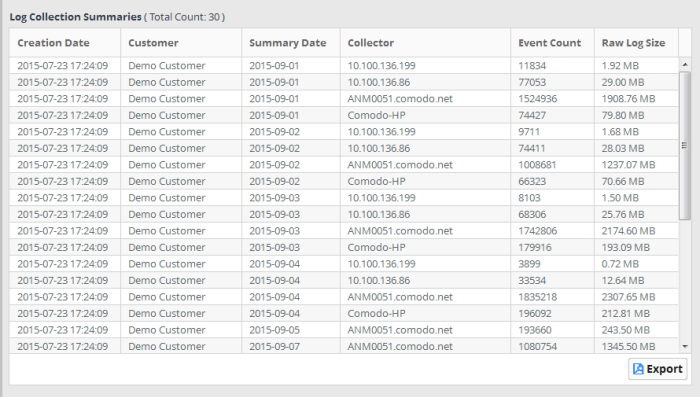
The 'Log Collection Summaries' pane in the right hand side displays the summary of logs collected at each day from each agent/endpoint of the selected customer's networks, within the specified period.
|
Log Collection Summary Interface - Table of controls |
|
|---|---|
|
Column Header |
Description |
|
Creation Date |
Displays the date at which the customer was added to NxSIEM. |
|
Customer |
Displays the name of the customer. |
|
Summary Date |
Displays the log collection date for which the summary is displayed in the row. |
|
Collector |
Displays the agent/endpoint from which the logs are collected |
|
Event Count |
Displays the number of events for which the logs are collected on that day from that agent/endpoint. |
|
Raw Log Size |
Displays the total size of log file collected from that agent/endpoint on that day. |
- To
view the log collection summary for all customers, choose 'All' from
the 'Customer' drop-down, specify the start and end dates for the
log collection period and click 'Search'. The details of the logs
collected will be displayed at the right panel. The pie chart at the
lower left panel will display a breakdown of sizes of log files
collected from each customer network. Placing the mouse cursor on
the chart displays the total size of log files from the specific
customer.
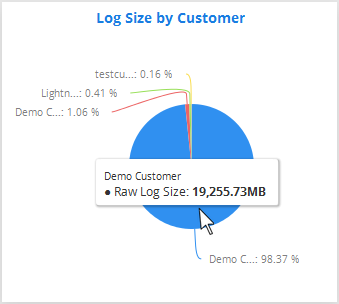
- To view the log collection summary for a specific customer, choose the customer from the 'Customer' drop-down, specify the start and end dates for the log collection period and click 'Search'. The details of the logs collected will be displayed at the right panel. The pie chart at the lower left panel will display a breakdown of sizes of log files collected from each agent/endpoint in the customer networks. Placing the mouse cursor on the chart displays the total size of log files from the specific agent/endpoint.

-
To save the displayed Log Summaries table as a .pdf file, click the 'Export' button.
The .pdf file will be displayed in a new browser tab, which enables you to print or save the file.