Step 6 - Configure Correlation Rules
- The correlation rule area lets you create rules which monitor networks for certain events.
- Events which match these rules are called 'Correlated Incidents'. These are automatically assigned to admins for further action.
- Correlation rules are created by defining query groups and aggregation parameters based on the event you want to capture. Each query group can be created by selecting saved 'Event Queries' and/or by adding new queries.
- The output from a correlation rule is also created as an event which can be queried from the 'Event Query' interface.
To create a correlation rule
- Select a customer from the 'Customers' drop-down on the upper left:
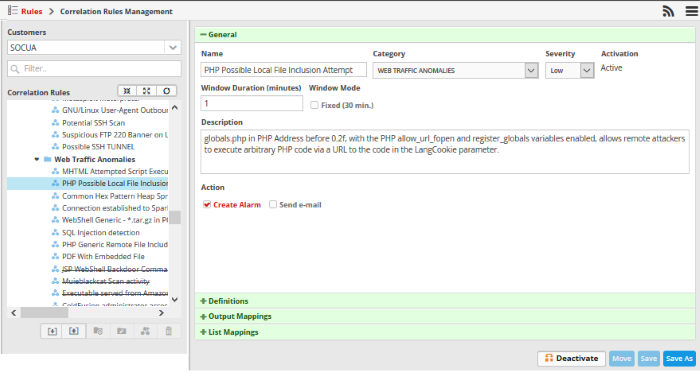
A built-in correlation rule is selected by default, and its parameters shown on the right. The left-hand pane shows predefined and custom rules available for the selected customer. Before creating a correlation rule, you have to create a folder under which the rule should be saved.
- Select the appropriate rule category folder or create a new correlation rule folder under which you want to create a correlation rule.
- Click
the
 folder button at the bottom on the left. The 'Folder Name' dialog
will appear.
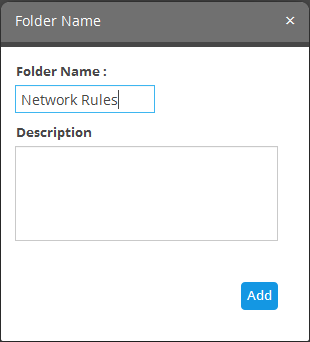
- Enter a name for the rules folder in the 'Folder Name' field
- Enter a description for the category of rules to be added to the new folder
- Click the 'Add' button
The folder will be saved and displayed on the left side.
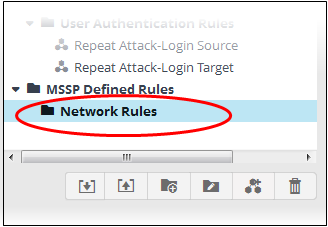
The relevant correlation rules can now be placed under the newly created folder.
- To
create a correlation rule under a folder, select it and click the
 button.
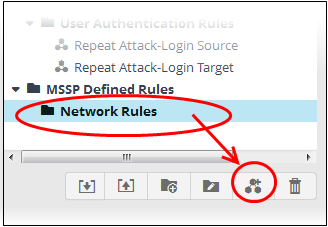
The configuration screen for creating the new rule will be displayed in the right hand side panel. It has four sections:
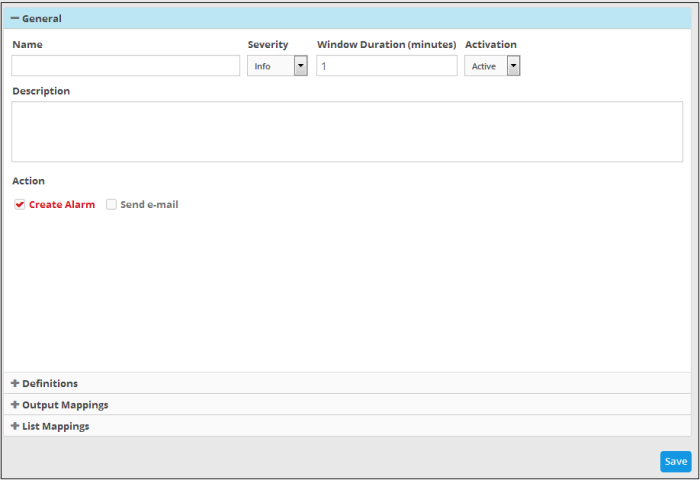
- General - Allows you to specify the name and description for the rule, category, select the severity level, window duration for rule, to set rule active or inactive and set whether or not to create an Incident when this rule is met.
- Definitions - Allows to define the queries for the rule and select aggregation parameters for grouping identified events and more.
- Output Mappings - Allows you to select the field values to be included in the output events generated based on the rule. The output events can be queried from the 'Event Query' interface (Optional).
- List Mappings - Allows you to map live lists to which the selected field values of the events detected by the rule is to be updated (Optional).
- Click the 'General' Stripe to open the General Configuration area.

- Name - Enter a name for the rule
- Category – Select the type of rule. These options can be customized in the 'Incident Category Management' interface. The default categories are:
- Authentication Anomalies
- Anomalies in privileged user account activities
- Anomalies specific to endpoint and backend
- Check for known APS
- Correlated
- DNS Request Anomalies
- Malware Activity
- Malware
- Manual
- Scheduled Query
- Unusual Network Traffic
- Unpatched for Vulnerable Systems or applications
- Web traffic anomalies
- Severity - Choose the severity level that will be assigned to the incident that matches the rule. The options available are:
- Info
- Low
- Medium
- High
- Critical
- Window Duration (minutes) - Enter the minimum duration (in minutes) for the event to be identified as an incident based on the rule.
- Activation - Choose whether you want the rule to be active or inactive from the drop-down
- Description - Enter an appropriate description for the rule. The description entered in this field will appear as the 'Summary' in the incident generated by the rule.
- Create Alarm - Configure whether or not an 'Incident' is to be created and an alert is to be sent to the administrator, when the rule is met. If selected, the rule creates an incident and an output event which can be queried from the 'Event Queries' interface. Else the rule creates only the output event and does not create an Incident.
- Send
e-mail – Select this check-box if an email alert should be
sent to the administrator when an incident is created.
Each rule is constructed with a set of filter condition statement groups to identify the events and generate alarms. The definitions stripe allows to define filter statement groups and aggregation parameters for the rule. You can add filter statement groups by selecting saved queries and/or by manually defining them.
- Click the 'Definitions' stripe, to open the 'Definitions' area.
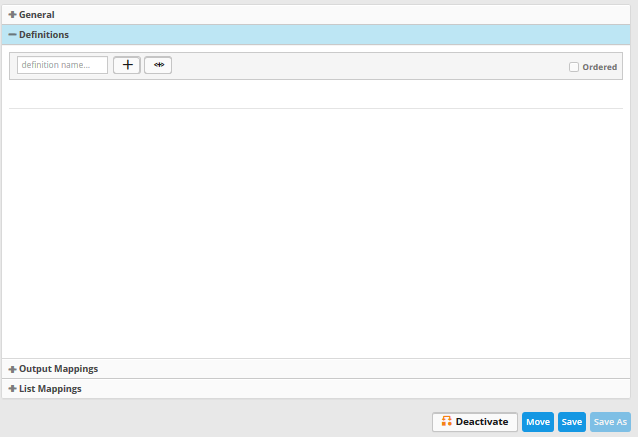
- To add a filter statement group as a rule definition, enter a name for the rule definition.
The next step is to add the filter condition statement groups to the definition. This can be done in two ways:
Selecting an Event Query and import filter statements:
- Click
the
 button after entering a name for the rule definition.
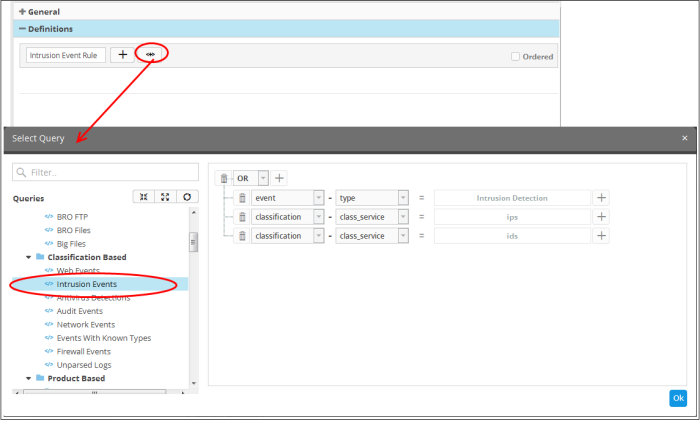
The 'Select Query' dialog will open with a list of pre-defined and custom event queries added for the customer in the left pane.
- Choose the query from the left pane.
The filter statements in the query will be displayed in the right pane.
- Click 'OK' to import the filter statements.
The rule definition will be added with the group of filter statements from the query.
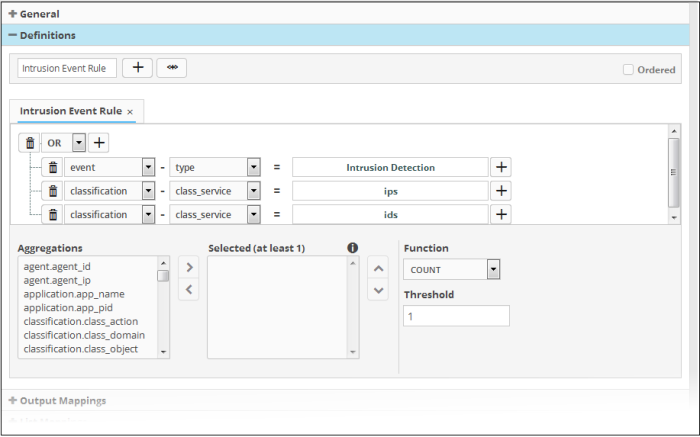
You can edit the group by adding new statement(s), changing fields/values and/or removing existing statements. For more details on construction of the filter statements, see 'Manually defining filter statements for the group' given below.
- Repeat the process to add more definitions from event queries.
Manually defining filter statements for the group
- Click the button after entering a name for the rule definition.
A tab to add the query fields for
the definition will open.
Each rule definition is built with a set of filter statements that are connected with Boolean operators like 'AND', 'OR' or 'NOT'. This is similar to building an event query. Click here to see the details.
You can add multiple query definitions for a single rule and these are tied together.
- To add a new definition, enter the name of the new definition and add the filter statements as explained above.
- If you want the rules engine to process the definitions of the rule in order, select the 'Ordered' check-box.
For example, under the first tab you can create a rule that checks for a brute force attack on a destination IP and in the second tab you can create a rule for intrusion detection. The rules engine checks for brute force attack and intrusion events and if any destination IP of the second tab matches the destination IP of the first tab, then an incident is created. Please note the number of selected aggregates should be equal for all the tabs in order to correctly define the fields in the 'Output Mappings' section. For example, if you select 4 aggregate fields in the first tab, then all other tabs for the rule should also have 4 aggregate fields.
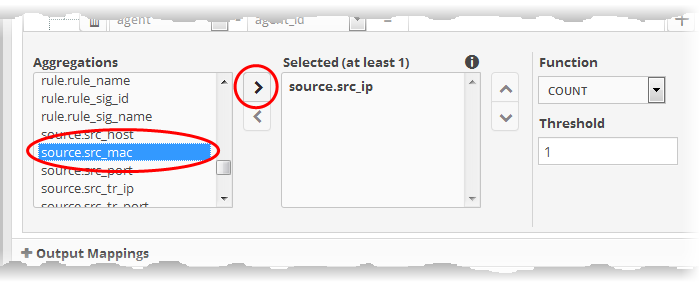
The next step is to select the field values based on which the events that meet the rule are to be aggregated to create the incident.. For example if you want the rule to search the source details from where the event occurred, then you have to select the appropriate event value from the 'Aggregations' box and move it to the 'Selected' box.
- Select
the required values from the 'Aggregation' box and move them to the
'Selected' box by clicking the
 button.
- To
remove a value added to the 'Selected' box by mistake, select it and
click the
 button.
- To
reorder in the values in the 'Selected' box, select them one by one
and click the
 or
or  buttons.
The next step is to define the 'Aggregation Function' and 'Aggregation Threshold' for the defined query. The 'Function' drop-down has three options:
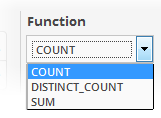
- COUNT - Select this if the incident is to be generated if the number of events that met the queries in the definition reach a certain number and enter the number in the Threshold field that appears on selecting this option.
- DISTINCT_COUNT - Choose this for the definition that checks for a range of events, for example, different source IPs to a single IP, choose the event items in the 'Distinct Field' combo boxes and enter the value in the 'Threshold' field.
- SUM - Choose this for the definition that checks for a numeric value, for example, number of bytes transferred or the rule hit count, select the event item in the 'Sum (Count)' field and enter the value in the 'Threshold' field.
You can create any type of rules as required for your customers. For better insight into rules creation, please check out the built-in predefined rules on the left side of the 'Correlation Rules Management' screen.
- In addition to generating an 'Incident', cWatch Network generates a new event as output event every time events are detected as per a correlation rule.
- The output event can be queried from the 'Event Query' interface and its details can be used to generate further event queries for the customer.
- The 'Output Mappings' area allows you to define the values to be fetched for selected fields of the output event from the respective input events detected by the rule.
- You can choose only values that are common to all the input events that generated an 'Incident' as per the rule.
- This is optional and for full details, see 'Manage Correlation Rules'.
- The 'List Mappings' area allows you
to choose the Live Lists to which the selected field values of the
events detected by the rule are to be automatically updated.
- This is optional and for full details see 'Manage Correlation Rules', 'Manage Live Lists' and 'Manage Live List Content'.
- You can also export and import correlation rules from one customer to another customer. See 'Manage Correlation Rules' for more details.


