Comodo Help
Find the desired product help
Xcitium SIEM

Xcitium SIEM

cWatch MDR Admin Guide

English

Print Help Download Help
Incidents Overview > Incidents
  • Introduction To Xcitium MDR
    • Purchase A License
    • Log-in To The Admin Console
  • The Home Screen
  • Service Summary
  • Incidents Overview
    • Incidents
  • Log Collection Summary
  • Tickets
  • Reports
  • Notification Settings
  • Integrate Your Office 365 Account With MDR
  • About Xcitium Security Solutions

Incidents


Shows the top incidents on your network by type, and the severity of those incidents. Further details on each incident are shown in the table in the lower pane.

  • Click 'Incidents Overview' > 'Incidents' to open the interface
  • Select a customer at top-right


    • By default, statistics are shown for the past seven days
    • To view the data for a different time period, click the date range at the top and choose from the options:


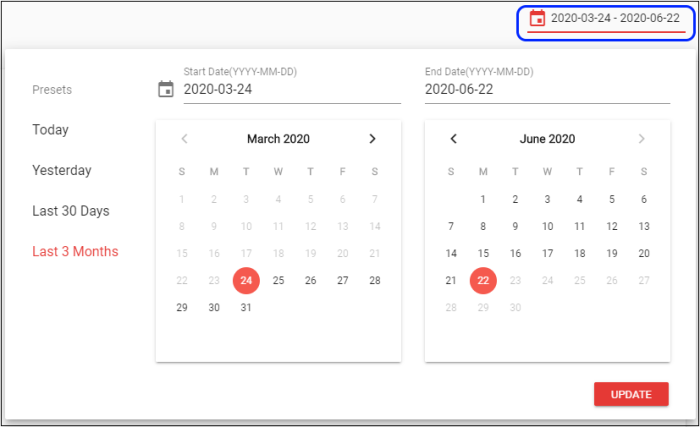
      • To view data for a custom period, select from and to dates from the calendars
      • Click 'Update'

      The top pane shows the incidents by their severity.


      • Click a tile to view the incidents at the bottom pane

      Use the filters to search for particular incidents:


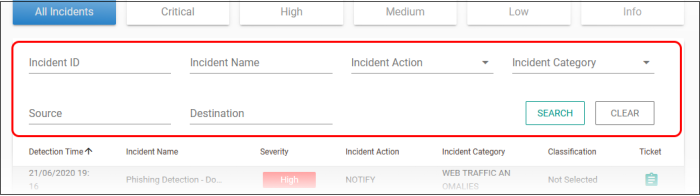
      • Enter / select the filter parameter(s) and click ‘Search’
      • Incidents matching the filter are shown below
      • Click ‘Clear’ to view all incidents again.

      The lower pane shows the incidents for the selected time period:


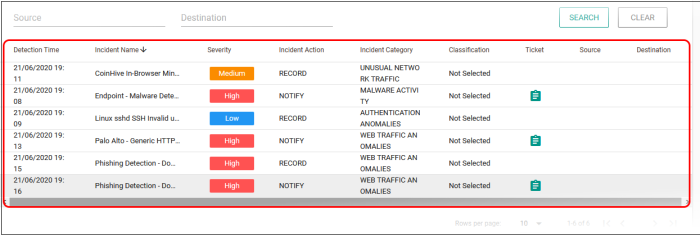
      Click a column header to sort the incidents by alphabetical / ascending / descending order.

      • Detection Time – The date and time the incident was logged.
      • Incident Name – The rule label that triggered the incident.
      • Severity – Incident grade whether critical, high, medium, low or information
      • Incident Action – The response to the incident per the rule
      • Incident Category – The incident type. For example, 'Malware activity' or 'Unusual network Traffic'
      • Classification – Indicates to which the group the rule that triggered the incident is added to.
      • Ticket – Opens the related incident’s tickets interface.
      • Source – The origin IP address that the rule detected
      • Destination – The final network / endpoint IP address
       

      View incident details

      • Click anywhere on an incident row to view even more details like incident ID, admin remarks, and more.


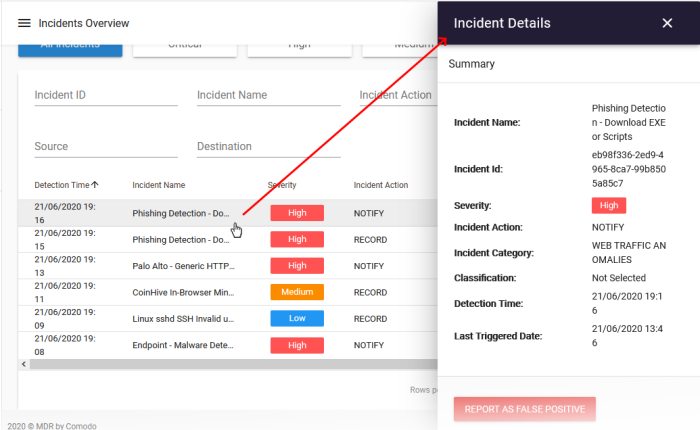
      • Click ‘Report as False Positive’ if you know the incident is not a threat or malicious.
      Our Products
      • Free Antivirus
      • Free Internet Security
      • Website Malware Removal
      • Free Anti-Malware
      • Anti-Spam (Free Trial)
      • Windows Antivirus
      • Antivirus for Windows 7
      • Antivirus for Windows 8
      • Antivirus for Windows 10
      • Antivirus for MAC
      • Antivirus for Linux
      • Free Endpoint Security
      • Free ModSecurity
      • Free RMM
      • Free Website Malware Scanner
      • Free Device Manager for Android
      • Free Demo
      • Network Security
      • Endpoint Protection
      • Antivirus for Android
      • Comodo Antivirus
      • Wordpress Security
      Cheap CDN
      • Bootstrap CDN
      • Semantic UI CDN
      • Jquery CDN
      • CDN Plans
      • CDN
      • Free CDN
      Enterprise
      • Patch Management Software
      • Patch Manager
      • Service Desk
      • Website Down
      • Endpoint Protection Solutions
      • Website Security Check
      • Remote Monitoring and Management
      • Website Security
      • Device Manager
      • ITSM
      • CRM
      • MSP
      • Android Device Manager
      • MDR Services
      • Managed IT Support Services
      • Free EDR
      Free SSL Certificate
      Support Partners Terms and Conditions Privacy Policy

      © Comodo Group, Inc. 2025. All rights reserved.