Step 6 - Create Correlating Rules to Monitor Networks for Incidents
NxSIEM monitors the logs received
from enrolled customers networks, based on rules added for the
customer and generates 'Incidents' on identifying events that match
the conditions specified in the rules. The incidents are notified by
alerts and automatically assigned to the users allotted to the
respective customer for investigation and appropriate countermeasure.
NxSIEM ships with a set of pre-configured correlation rules for each customer. In addition, you can create and add custom rules for each customer. Following sections explain on:
Rules can be created by adding filter statement groups as conditions and specifying aggregation parameters. Optionally, you can configure how the output events are to be generated when the rule is met and to feed selected field values involved in events identified by the rule to Live Lists, for use in creating queries and other rules.
To view the 'Rule Creation and Activation' interface
- Click the 'Menu' button from the top right, choose 'Rules' and then click 'Rules Activation and Creation'.
- Choose the customer from the drop-down at the top left.
The 'Rule Creation and Activation' interface displays a list of pre-configured rules added for the customer under respective category folders in the left pane. Selecting a rule displays its details in the right pane.
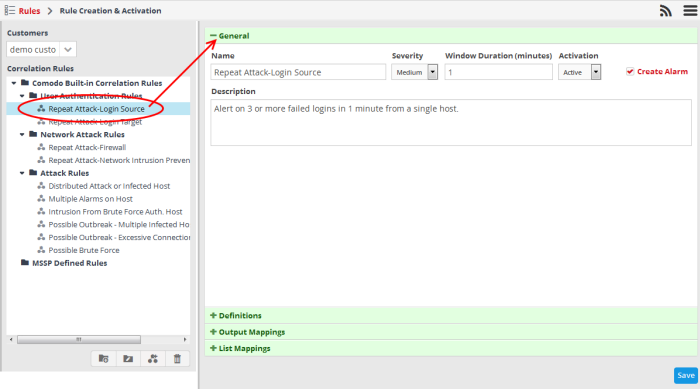
To create a rule
- Select the customer from the 'Customers' drop-down on the left side.
- Select the appropriate rule category folder or create a new correlation rule folder under which you want to create a correlation rule.
- Click
the
button
The configuration screen for creating the new rule will be displayed in the right hand side panel. It has four sections:
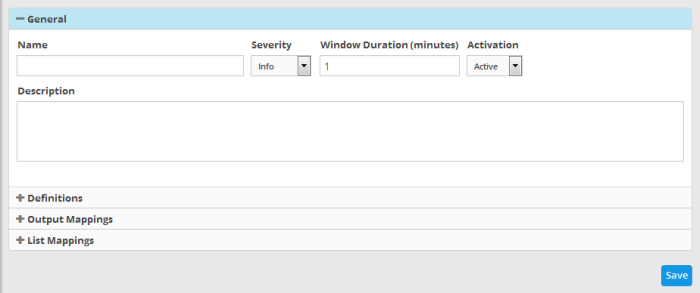
- General - Allows you to specify the name and description for the rule, select the severity level, window duration for rule, to set rule active or inactive and set whether or not to create an Incident when this rule is met.
- Definitions - Allows to define the queries for the rule and select aggregation parameters for grouping identified events and more.
- Output Mappings - Allows you to select the field values to be included in the output events generated based on the rule. The output events can be queried from the 'Event Query' interface (Optional).
- List Mappings - Allows you to map live lists to which the selected field values of the events detected by the rule is to be updated (Optional).
The rest of this section explains on configuring General and Definitions sections for a rule. The 'Output Mappings' and 'List Mappings' are optional. For detailed explanations and tutorials on configuring those sections, refer to the online help page of the administrator guide at https://help.comodo.com/topic-325-1-675-8387-Managing-Rules.html
- Click the 'General' Stripe to open the General Configuration area.
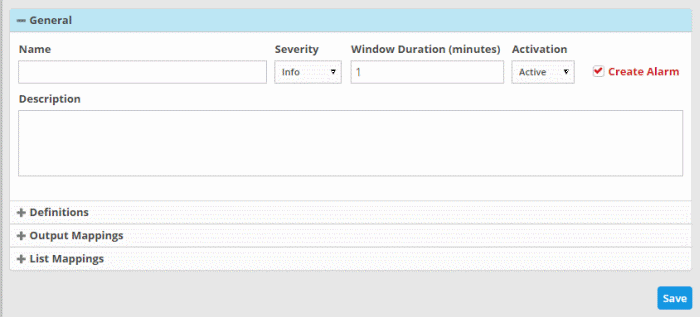
- Name - Enter a name for the rule
- Severity - Choose the severity level that will be assigned to the incident that matches the rule.
- Window Duration (minutes) - Enter the minimum duration (in minutes) for the event to be identified as an incident based on the rule.
- Activation - Choose whether you want the rule to be active or inactive from the drop-down
- Create Alarm - Configure whether or not an 'Incident' is to be created and an alert is to be sent to the administrator, when the rule is met. If selected, the rule creates an incident and an output event which can be queried from the 'Event Queries' interface. Else the rule creates only the output event and does not an Incident.
- Description - Enter an appropriate description for the rule. The Description entered in this field will appear as the 'Summary' in the incident generated by the rule.
Each rule is constructed with a set of filter condition statement groups to identify the events and generate alarms. The 'Definitions' stripe allows to define filter statement groups and aggregation parameters for the rule. You can add filter statement groups by selecting saved queries and/or by manually defining them.
- Click the 'Definitions' stripe to open the 'Definitions' area.
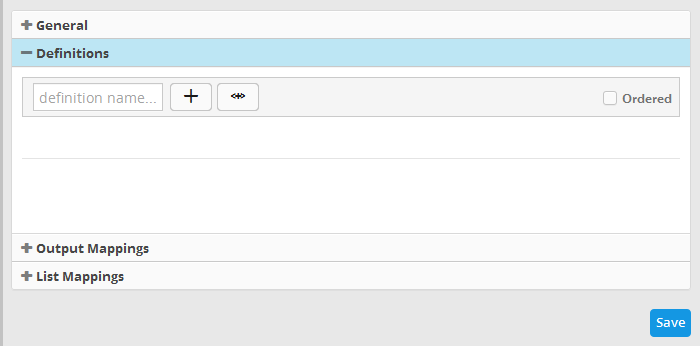
- To add a filter statement group as a rule definition, enter a name for the rule definition.
The next step is to add the filter condition statement groups to the definition. This can be done in two ways:
Selecting an Event Query and import filter statements:
- Click
the
button after entering a name for the rule definition.
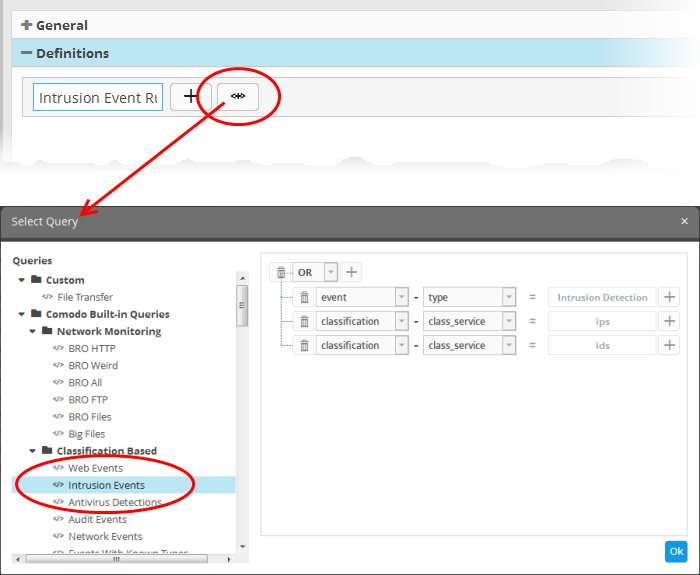
The 'Select Query' dialog will open with a list o pre-defined and custom event queries added for the customer in the left pane.
- Choose the query from the left pane.
The filter statements in the query will be displayed in the right pane.
- Click 'OK' to import the filter statements.
The rule definition will be added with the group of filter statements from the query .
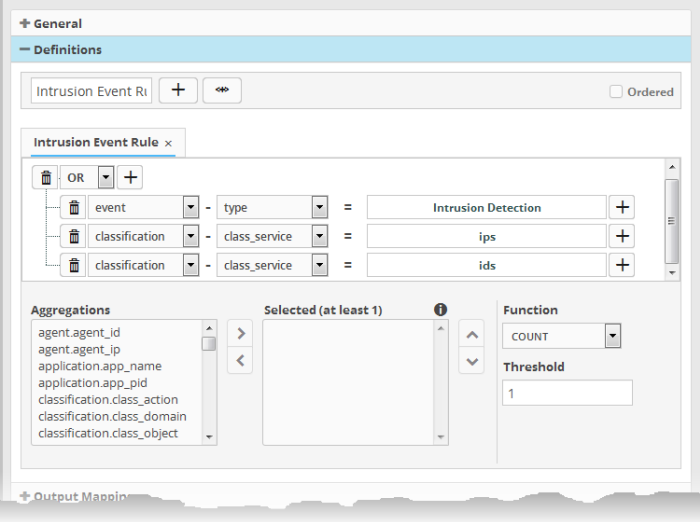
You can edit the group by adding new statement(s), changing fields/values and/or removing existing statements. For more details on construction of the filter statements, refer to the explanation of 'Manually defining filter statements for the group' given below.
- Repeat the process to add more definitions from event queries.
Manually defining filter statements for the group
- Click the
button after entering a name for the rule definition.
A tab to add the filter statements
for the definition will open. Adding filter statements to the group
is similar to that for an event query. Refer to the explanation
of adding filter statements under 'To create a new custom query' for a tutorial on adding filter statement groups to the rule.
You can add multiple query definitions for a single rule and these are tied together.
- To add a new definition, enter the name of the new definition and add the filter statements as explained above.
- If you want the rules engine to process the definitions of the rule in order, select the 'Ordered' checkbox.
The next step is to select the field values based on which the events that meet the rule are to be aggregated to create the incident.. For example if you want the rule to search the source details from where the event occurred, then you have to select the appropriate event value from the 'Aggregations' box and move it to the 'Selected' box.
- Select
the required values from the 'Aggregation' box and move them to the
'Selected' box by clicking the
button.
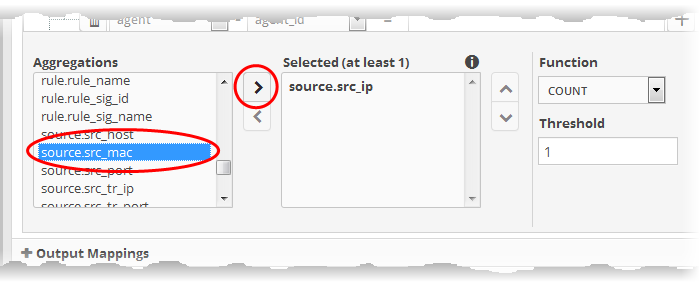
- To
remove a value added to the 'Selected' box by mistake, select it and
click the
button.
- To
reorder in the values in the 'Selected' box, select them one by one
and click the
or
buttons.
The next step is to define the 'Aggregation Function' and 'Aggregation Threshold' for the defined query. The 'Function' drop-down has three options:
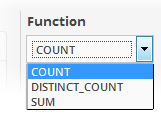
- COUNT - Select this if the incident is to be generated if the number of events that met the queries in the definition reach a certain number and enter the number in the Threshold field that appears on selecting this option.
- DISTINCT_COUNT - Choose this for the definition that checks for a range of events, for example, different source IPs to a single IP, choose the event items in the 'Distinct Field' combo boxes and enter the value in the 'Threshold' field.
- SUM - Choose this for the definition that checks for a numeric value, for example, number of bytes transferred or the rule hit count, select the event item in the 'Sum (Count)' field and enter the value in the 'Threshold' field.
For example, under the first tab you can create a rule that checks for a brute force attack on a destination IP and in the second tab you can create a rule for intrusion detection. The rules engine checks for brute force attack and intrusion events and if any destination IP of the second tab matches the destination IP of the first tab, then an incident is created. Please note the number of selected aggregates should be equal for all the tabs in order to correctly define the fields in the 'Output Mappings' section. For example, if you select 4 aggregate fields in the first tab, then all other tabs for the rule should also have 4 aggregate fields.
You can create any type of rules as required for your customers. For better insight into rules creation, please check out the built-in predefined rules on the left side of the 'Rule Creation & Activation' screen.
|
Tip: The 'Output Mappings' and 'List Mappings' are optional. For detailed explanations and tutorials on configuring those sections, refer to the online help page of the administrator guide at https://help.comodo.com/topic-325-1-675-8387-Managing-Rules.html. |
- Click the 'Save' button to save your rule for the customer.
The rules engine checks the events
from the logs and if it matches the rule, generates an alert and
creates an incident.
The list of incidents generated on identification of events that match the rules added for the customer can be viewed from the 'Incident Management' interface. You can also view the complete details of a selected incident and can re-assign it to a different user too.
In addition to the incidents reported by the correlation rules, you can manually add incidents in order to assign specific jobs to the user allotted to a customer.
|
Tip: NxSIEM also allows you to group 'Incidents' that are mutually related or identified as series of events as a 'Case' and assign it to the user allotted for the customer. The user will be able to view the list of incidents to be attended together, take a consolidated remedial action and close the case. For more details refer to the online help page of the administrator guide at https://help.comodo.com/topic-325-1-675-8388-Incidents-and-Cases.html. |
To view the list of incidents
- Click the 'Menu' button from the top right, choose 'Incidents' and then click 'Incident Management' to open the 'Incident Management' interface.
- Select the filter options from the left pane of the 'Incident Management' interface
- To view all incidents without filtering, select 'All' in all the filter option drop-downs and click 'Search'.
- To view incidents detected from specific customer networks, assigned to specific users, of specific type, status and/or priority, select the option(s) from the respective drop-downs and click 'Search'.
|
Tip: To view a list of all incidents on all customer networks in this interface, click the notification icon on the title bar:
|
The example below, shows all incidents from all customer networks.
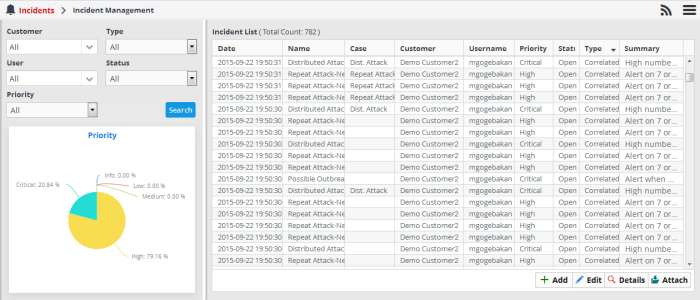
The left panel displays a pie-chart showing a breakdown of incidents based on priority. Placing the mouse cursor over a sector displays the count of incidents and priority/severity level.
To view the details of an incident
- Select an incident that you want to view the details and click the 'Details' button at the bottom
The 'Incident Details' pane displays complete details such as the name of the rule that triggered the alert, name of the customer, type of incident and more, of the selected incident. It also allows the administrator to view the details of events detected by the same rule from other endpoints in the same customer network at different time points. Use the 'Drill Down' report to view all the devices affected by the incident.
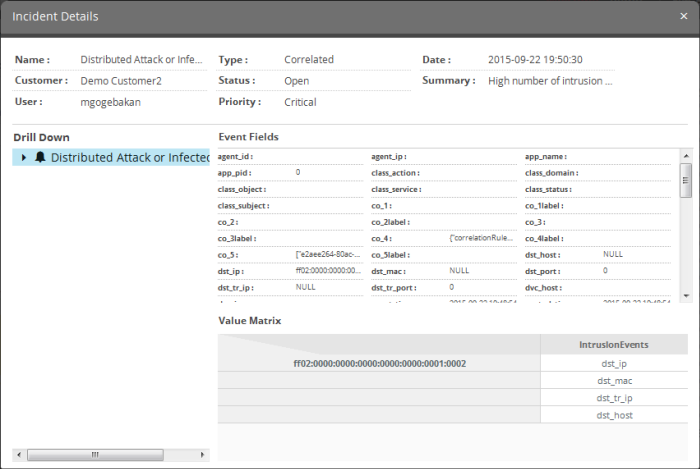
The upper portion displays the
details like name of the rule that triggered the incident, name of
the customer, type of incident, date and time the incident was
created and so on. Placing the mouse cursor over an item shows the
full details as a tool tip.

The 'Event Fields' pane at the
right displays the values of all the fields of the event detected as
the incident. The 'Value Matrix' pane at the bottom right displays
the aggregation values fed by the rule from the detected event, in
order to generate a new event indicating the event detection by it.
The 'Drill Down' pane at the left allows you to view the details of the incidents identified by the same rule.
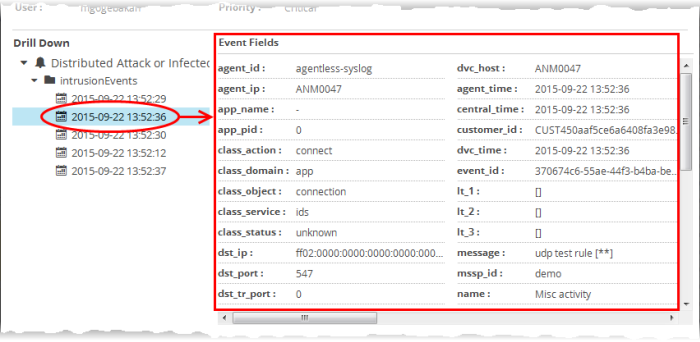
- To view the events, expand the folder structure under drill-down and select the time point.
The field values of the respective event detected at the time point will be displayed at the right.
To add and assign an incident
- Click the 'Add' button at the bottom of the screen.
The 'Add Incident' dialog will open.
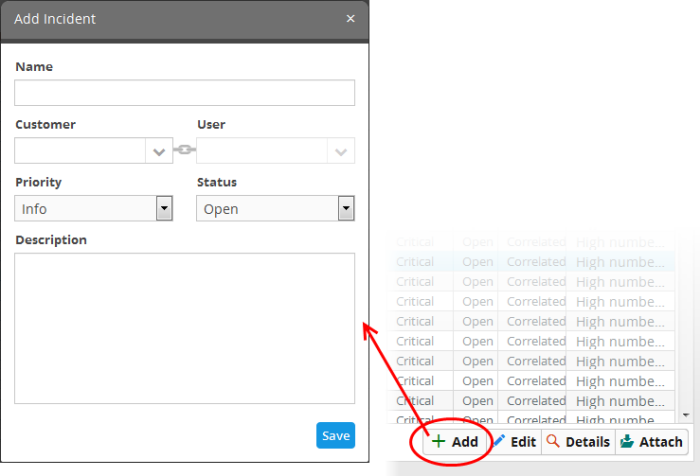
- Name - Enter a name for the incident.
- Customer - Choose the customer from the drop-down for whom you want to add the incident.
- User - The drop-down will display the users assigned to the selected customer. Choose the user to whom the incident is to be assigned. Refer to the section 'Administration' for details about assigning users to customers.
- Priority - Select the severity level of the incident from the drop-down. The options available are 'Info', 'Low', 'Medium', 'High' and 'Critical'.
- Status - Select the status of the incident from the drop-down. The options available are - Open, In Progress, False-Positive and Closed.
- Description - Enter an appropriate description for the incident
- Click the 'Save' button
Editing and Reassigning an Incident
You can change the status, edit the name, severity level of an incident at any time. You can also reassign an incident to a different user if required.
To edit an incident
- Use the filter options at the left to view the list of incidents pertaining to a specific customer, assigned to a specific user, specific type, status and/or priority level .
- Select the incident that you want to edit from the list and click the 'Edit' button at the bottom.
The 'Update Incident' dialog will be displayed.
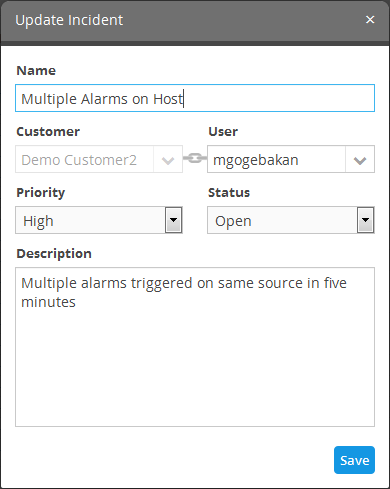
- Edit the details like Name, priority, status as required.
- To reassign the incident select the new user to whom the incident has to be assigned, from the User drop-down.
|
Note: The 'User' drop-down will display only the users that are added for the customer. Refer to the section 'Administration' for details about assigning users to customers. |
- Click the Save button for your changes to take effect.


