Step 4 - Generate Event Queries and View Events
Once the endpoints at customer networks are configured, NxSIEM collects and saves them in its database. You can search for specific events by running event queries created for the customer. NxSIEM returns the list of event log entries with field values matching those in the query, as a table. The results table contains selected field names as column headers. You can view all the fields with their values for any event log entry from the results table and even use them for creating further queries, perform an IP/Domain lookup of external IP addresses/domains involved in the event and more.
NxSIEM ships with a set of pre-defined queries
placed under respective category folders and allows you to create
custom queries too. You can search the event log database using both
pre-defined queries and custom queries.
The event queries can also be used for:
- Constructing custom dashboards which display query results as graphical charts. Refer to the online help page of the administrator guide at https://help.comodo.com/topic-325-1-675-8386-Configuring-Custom-Dashboards.html for more details.
- Constructing 'Correlation Rules' which identify harmful events/incidents on customer networks and assign them to customer administrators for attention. Refer to the next step 'Step 5 - Creating Correlating Rules to Monitor Networks for Harmful Incidents' for more details.
Each event query is built with a set of filter statements that connected by Boolean operators, 'AND', 'OR' or 'NOT'. Each filter contains the following components.
'Field Group' + 'Field' + 'Operator + 'Value'
- Field Group - The group to which the field specified as the filter parameter belongs.
- Field - The field in the event log entry by which you want to filter results
- Operator - Controls the relationship between the field and the specified value. Examples include 'Equals to', 'Does not equal to', contains, 'does not contain' etc.
- Value - The value for the field. Values can be entered manually or fetched from a pre-defined list which is managed in the Live List Management' interface. For example, if you choose a source IP (src_ip) as the field to be searched from network events, you can manually enter the IP address of the source of the connection request or choose a Live List containing a list of source IP addresses. More details on Live Lists are available in the online help page at https://help.comodo.com/topic-325-1-675-8897-Live-Lists.html.
To view the Event Query interface
- Open the 'Event Query' interface by clicking the 'Menu' button at the top right, then clicking 'Investigation' > 'Event Query'.
- Select the customer from the left hand side pane.
The interface displays the list of
pre-defined queries pertaining to the customer in the left side
panel.
To create a new custom query
- Select
the appropriate query category folder under which you want to add a
new query or create a new folder by clicking the
button at the bottom of the list and select it.
-
Click the
button.
A 'New Query' tab will be displayed
with its query builder pane below it.
|
Tip: You can also use the 'New Query' tab that is displayed as the first tab on selecting a customer, to create a new query. You can save the created query by selecting an appropriate folder from the left side panel. |

The next step is to add the filters for the query.
- Choose the combination condition for the query filter statements to be defined from the drop-down in the 'Query Builder' pane. The options available are:
- AND
- OR
- NOT
- Click
the
button to add a filter

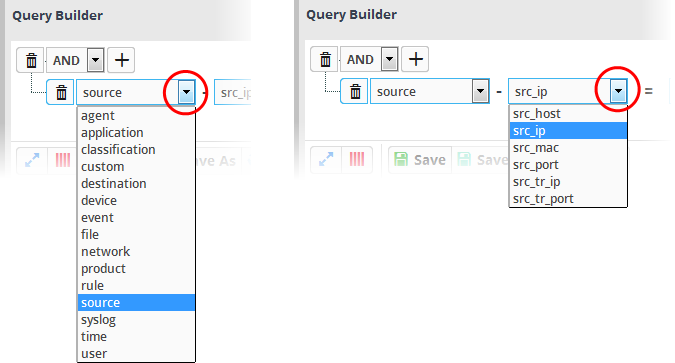
- Choose the field group you wish to add to the filter from the first drop-down.
The next field will display the fields available for the selected field group.
- Select the field whose value is to be specified as search criteria from the second drop-down.
|
Tip: The descriptions of the Field Groups and the Field items under each of them, are available in the online help page at https://help.comodo.com/topic-325-1-675-8452-Appendix-1--%E2%80%93-Field-Groups-and-Event-Items-Description.html. |
The next step is to choose the relationship operator between the field and the value specified.
- To choose an operator, click the drop-down between the two fields:
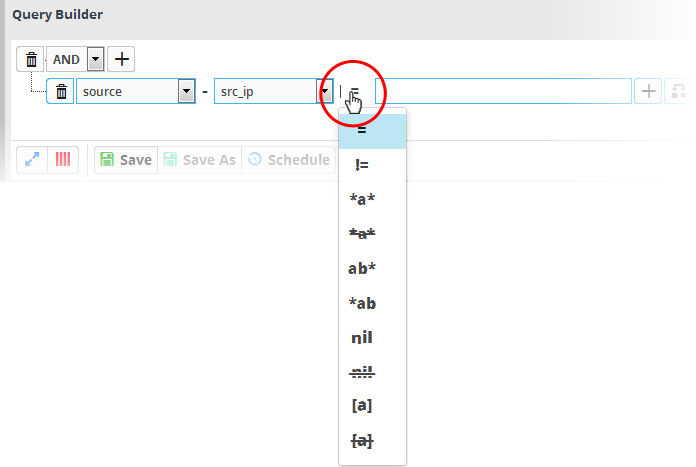
The
operators depends on the field chosen. The following table explains
the various operator symbols:
|
Relation Operator |
Description |
Entering the value for the 'Field' |
|---|---|---|
|
|
Equals to |
Manually enter a value in the field to the
right of the operator. |
|
|
Does not equal to |
Manually enter a value in the field to the right of the operator. Events that do not contain the value will be identified by the query. |
|
|
Greater than |
Applicable only for fields with numerical values, for example, port numbers. Manually enter a value in the field to the right of the operator. The query will identify events that contain values greater than the entered value. |
|
|
Greater than or equal to |
Applicable only for fields with numerical values, for example, port numbers. Manually enter a value in the field to the right of the operator. The query will identify events that contain values equal to or greater than the entered value. |
|
|
Less than |
Applicable only for fields with numerical values, for example, port numbers. Manually enter a value in the field to the right of the operator. The query will identify events that contain values less than the entered value. |
|
|
Less than or equal to |
Applicable only for fields with numerical values, for example, port numbers. Manually enter a value in the field to the right of the operator. The query will identify events that contain values equal to or lower than the entered value. |
|
|
Contains |
Manually enter a value in the field to the right of the operator. The query will identify events that contain the entered value somewhere in the string. For example, to search for events with source IP addresses containing 123 anywhere in the address, enter '123'. |
|
|
Does not contain |
Manually enter a value in the field to the right of the operator. The query will identify events that do not contain the entered value anywhere in the string. For example, to search for events with source IP addresses that do not contain 123 anywhere in the address, enter '123'. |
|
|
Starts with |
Manually enter a value in the field to the right of the operator. The query will identify events that begin with the entered value. For example, to search for events with source IP addresses starting with 192, enter '192'. |
|
|
Ends with |
Manually enter a value in the field to the right of the operator. The query will identify events that end with the entered value. For example, to search for events with source IP addresses that end with 123, enter '123'. |
|
|
Is Empty |
Searches for events in which the selected field is empty (does not contain any value). For example, to search for the events with no values in their source IP address fields, select 'Is Empty'. |
|
|
Is Not Empty |
Searches for events in which the selected field is not empty (contains a value of some kind). For example, to search for the events with some IP addresses values in their source IP address fields, select 'Is Not Empty'. |
|
|
Is in List |
Allows you to configure the filter statement to fetch values for the field from a pre-defined live list containing specific values for the field type. Background: Live Lists enable administrators to add and manage lists of values for different fields for use in queries and correlation rules. Lists can be created and the values can be updated manually or configured to be fetched from outputs of correlation rules. The updates in a list will be immediately reflected in the queries and the rules in which it is used, relieving the administrator from the burden of updating queries and rules for change in values to be queried. For more details on Live Lists management, refer to the online help page at https://help.comodo.com/topic-325-1-675-8897-Live-Lists.html. On selecting
The first drop-down shows the Live Lists that contain values for the selected query field. The second drop-down shows the List Types within the selected 'Live List'.
All the values contained in the list will be included as values for the Field specified in the filter statement. |
|
|
Not in List |
Allows you to configure the filter statement to search for the events that do not contain specific values from a pre-defined live list . On selecting
The results will display all events that do not contain the values in the live lists. |
- To
add a sub-filter statement, click the
button beside the filter and repeat the process.
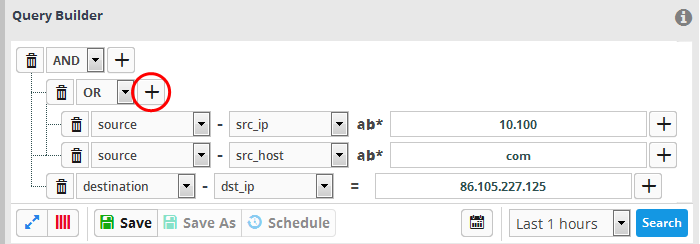
- To set the relationship between each statement, use the drop-down menu.
- For example, the query below will return events whose source ends with 10.100 OR .com AND whose destination is 86.105.227.125
- To
add more filter statements to the query, click the
button and repeat the process.
- To
delete a filter , click the
button beside it.
- Click the 'Save' button in the 'Query Builder' screen.
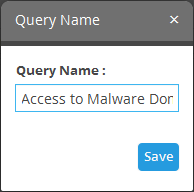
- Enter the name of the query in the 'Query Name' field and click the 'Save' button .
The next step is to run the event
query.
To run an event query
- Select an event query from the left.
- Select the period for which you want to run the query.
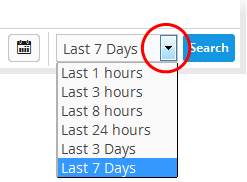
- To view recent events, select the period from the drop-down at the bottom right of the 'Query Builder' pane and click the 'Search' button. Options range from the last hour to the last 7 days.
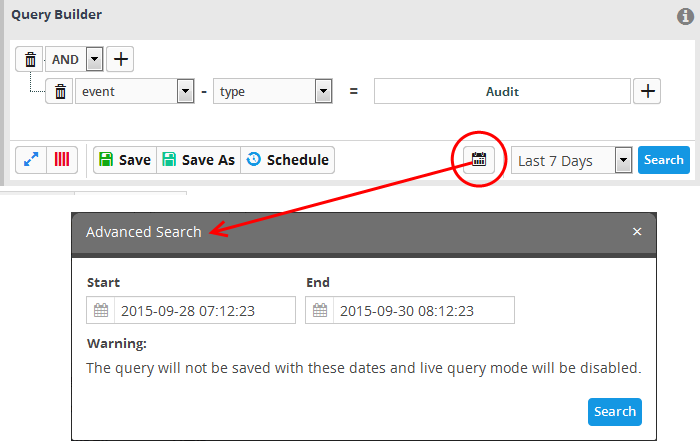
- To view events that occurred within specific dates, click the calendar button, enter the 'Start' and 'End' dates in the 'Advanced Search' dialog and click 'Search'.
- Select the 'Live' check box to search streaming data for the event query.
|
Note: The 'Live' option will not be available for advanced searches with specific start and end dates. |
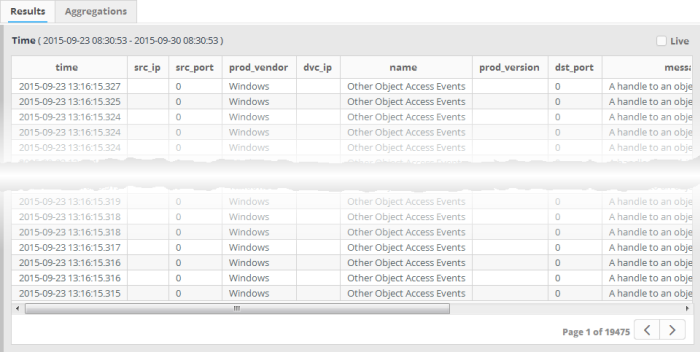
The 'Results' are displayed in the lower pane.
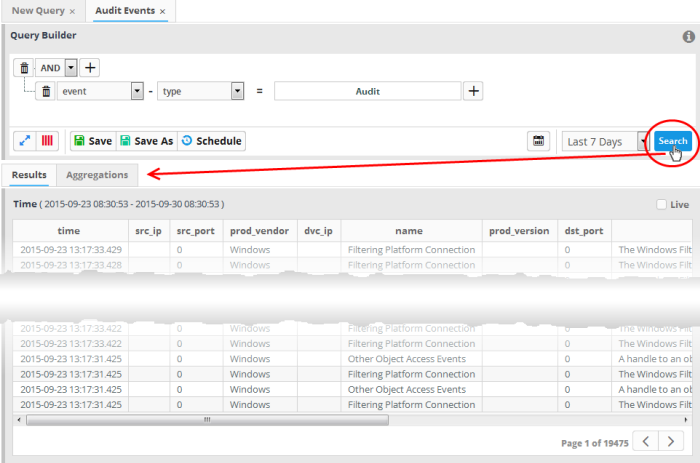
The lower pane has two tabs:
- Results - The 'Results' tab displays the list of log entries that match the query as a table, with relevant event fields as column headers. Clicking on an event allows you to view its details.
- Aggregations - The Aggregations tab allows you to group identified events and view aggregations of the identified events.
The rest of this section explains on viewing the results table. For detailed explanations and tutorials on viewing event aggregations, refer to the online help page of the administrator guide at https://help.comodo.com/topic-325-1-675-8385-Configuring-Event-Queries.html
The 'Results' table shows list of event log records that match the event query, with event log entry fields, relevant to the query, as table headers.
|
Tip: The Query builder allows you to even customize the fields to be displayed as table headers in the table. For more details, refer to the explanation under 'Configure results table for a query ' in the online help page https://help.comodo.com/topic-325-1-675-8385-Configuring-Event-Queries.html of the administrator guide. |
You can view complete details of an
event log entry from the 'Results' table and use the values to add
further filters statements to the query in order to refine the
search. You can also perform IP and Domain lookups and feed these
values to live lists for use in other queries and correlation rules.
- To view the details of an event, click on the result row.
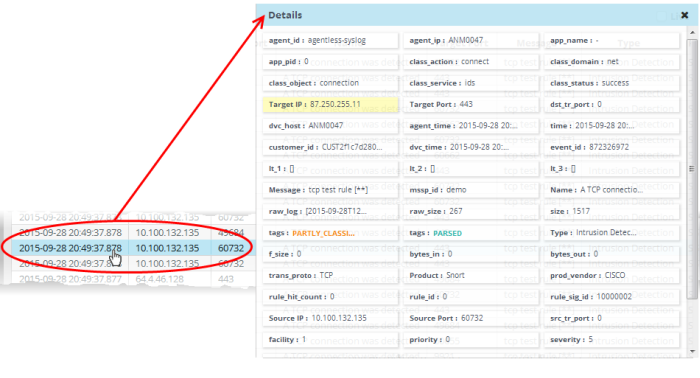
External IP addresses and domain names are highlighted in yellow.
- Clicking on a field adds the field with its value as a filter statement to the query, enabling you to refine your search for events that contain the same value in the respective field and/or to create a new query.
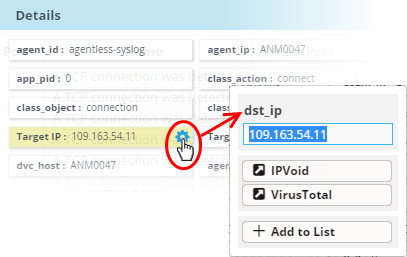
- Clicking the gear icon that appears at the right end on hovering the mouse cursor over a field opens a context sensitive menu, that allows you to:
- Perform IP lookup of external IP addresses using IPVOID by clicking on the 'IPVoid' button.
- Perform IP Address/Domain lookup using Virus Total by clicking on the 'VirusTotal' button.
- Add the value to a Live List. Refer to the online help page at https://help.comodo.com/topic-325-1-675-8897-Live-Lists.html for more details on live lists.
