


Step 7 - Generate Reports
NxSIEM allows you to configure and
generate event reports covering a wide range of security and
productivity criteria, by fetching data from the results of selected
event queries. The reports can display details of events matching
events queries added for a customer, as tables, pie charts and bar
charts.
NxSIEM ships with a set of pre-configured report types under different category folders. You can configure custom reports too as required.
To open the Report Management interface, click the 'Menu' button from the top right, choose 'Reporting' and then click 'Report Management'.
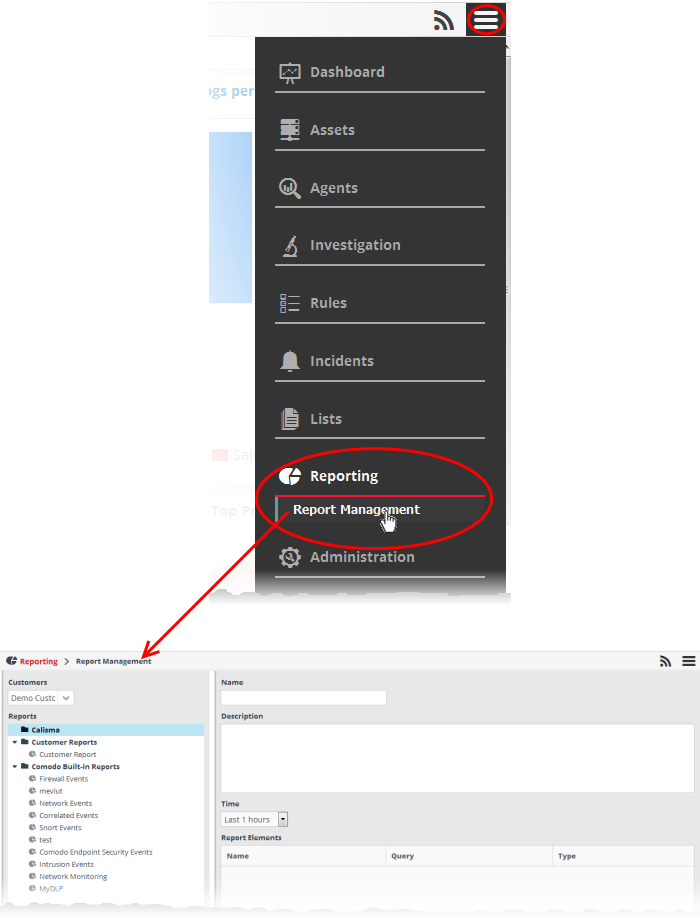
The left hand side panel of the interface displays a list of predefined reports and custom queries added for the selected customer under respective category folders. The right hand side panel displays the configuration area for report generation.
To configure a new report type for a customer
- Choose the customer from the 'Customers' drop-down at the top of the left panel.
A list of predefined reports added for the customer is displayed as a tree structure in the 'Reports' pane.
- Select the appropriate folder or create a new folder under which you want to create a report.
- Click
the
 button.
The configuration screen for creating the new report will be displayed in the right hand side panel. It has four areas:
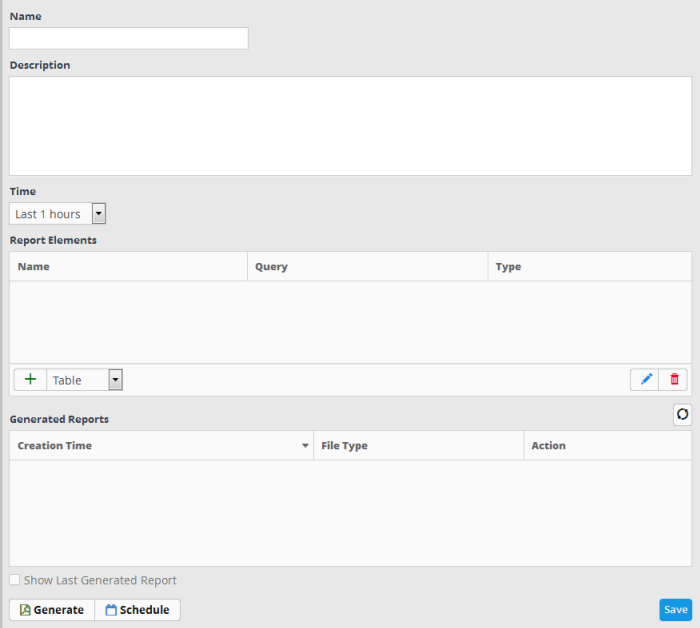
- Enter a name for the report in the 'Name' field
- Enter an appropriate description for the report in the 'Description' text box
- Select the period for which the events are to be included in the report, from the 'Time' drop-down
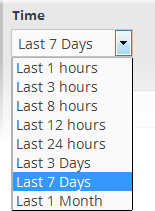
The period options range from last
one hour to the entire previous month of the report generation time.
The next step is to add the component tables/charts to be included in the report. The events for populating the tables/charts are fetched from the query results.
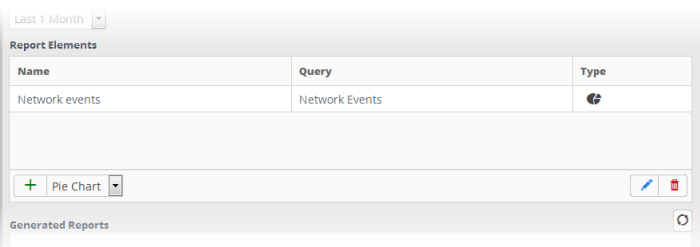
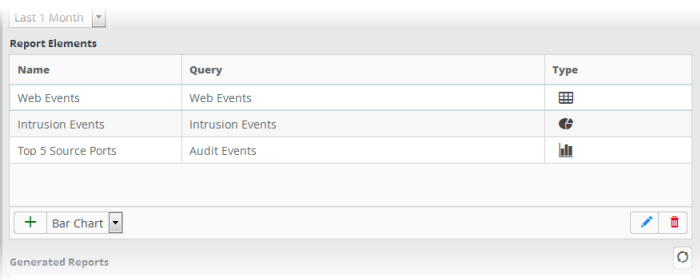
- Select the type of report element that should be added, from the drop-down at the bottom of the 'Report Elements' area.
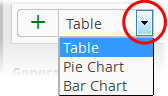
The options available are:
- Table - The report component will contain the details of the events that match the query selected. Refer to the explanation on adding a table given below, for more details.
- Pie Chart - The report will contain a pie-chart showing the statistical summary of the events that are aggregated based on parameters configured for the chart. Refer to the explanation on adding a pie chart given below , for more details.
- Bar chart - The report will contain a bar-chart showing the statistical summary of the events that are aggregated based on parameters configured for the chart. Refer to the explanation on adding a bar chart given below , for more details.
The Table Type report is configured just by selecting the event query from the list of queries added for the customer. The resultant report will contain all the details of the events that match the query, detected within the selected time period, displayed as a table.
To add a Table type report
- Select
'Table' from the drop-down and click the
 button beside it.
The configuration dialog for adding
a report table will appear with a list of all event queries
configured for the customer.
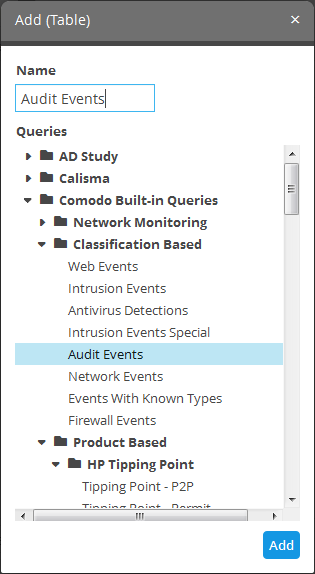
- Enter
the name for the report element in the 'Name' field.
- Select the event query for which you want to generate a report in table format.
- Click the 'Add' button.
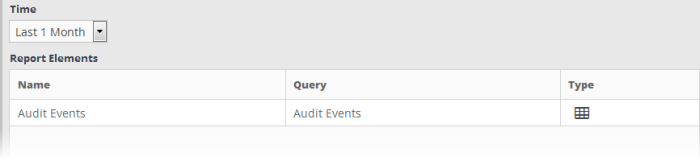
The report element will be added to the report.
'Pie Chart' type and Bar Chart Type Report Elements
The chart type report is
configured just by selecting the event query from the list of queries
added for the customer. The resultant report will contain all the
details of the events that match the query, detected within the
selected time period, displayed as a pie-chart or a bar chart as
chosen.
To add a Pie Chart type or Bar chart type report
- Select
'Pie Chart'/'Bar chart' as required. from the drop-down and click
the
button beside it

The
configuration dialog for adding a report pie chart will appear with a
list of all event queries configured for the customer at the left.
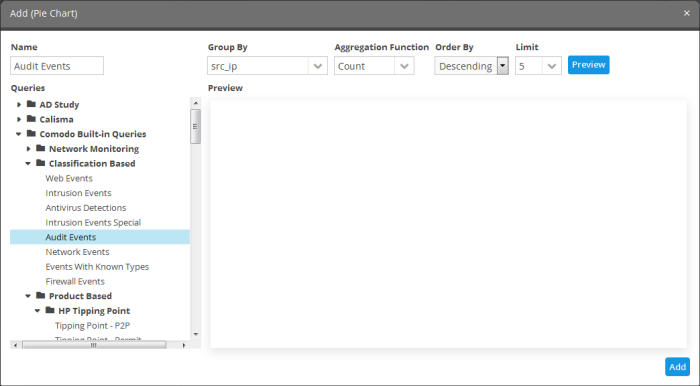
The configuration parameters for the report chart are similar to those for creating a dashboard chart in custom dashboard generation. Refer to the section explaining Configuring Custom Dashboards in the section Step 5 – Creating Custom Dashboards for Customer Networks for a detailed explanation of the parameters and a tutorial in configuring them.
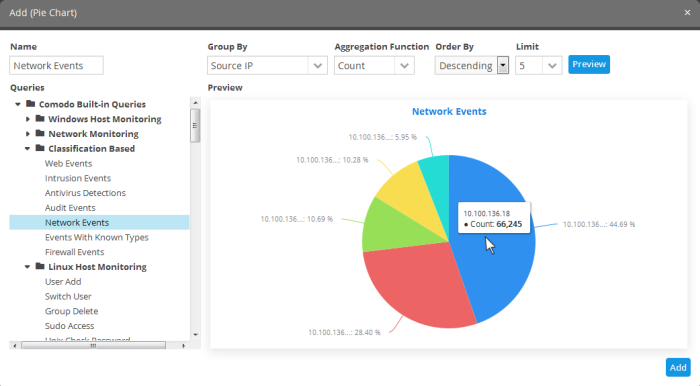
- Click the 'Preview' button to check the chart before adding it to the report.
- Click
the 'Add' button
- Repeat the process to add more report elements to the report.
The 'Report Elements' area displays the list of
report components added to the report.
Now that you have configured a report, you can generate the report and/or schedule the report generation.
After configuring a
report, you can generate it manually or specify the automatic
generation of the report according to a schedule of your choice.
To manually generate a report
- Select the report from the list.
The details of the report with the list of report elements will be displayed in the configuration area at the right.
- To generate the report instantly, click the 'Generate' button.
The report generation will be
started and on completion, it will be added to the list under
'Generated Reports' and its time stamp will be added to the 'Creation
Time' column.
The 'Generated Reports' area displays a list of reports generated manually or as per the schedule created for the report.
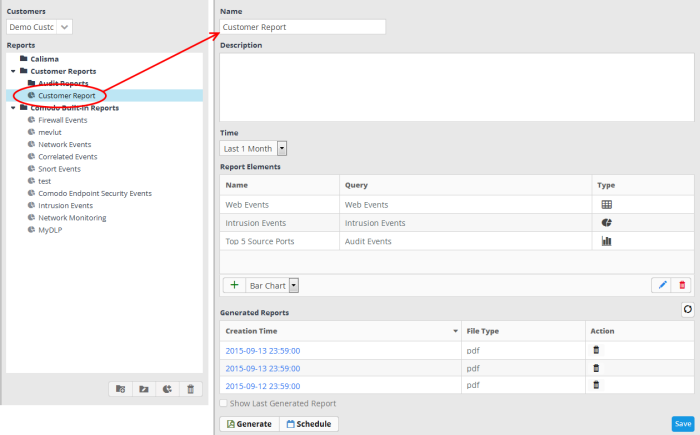
- To download the report, click the time stamp under the 'Creation Time' column.
- To view the report instantly select the 'Show Last Generated Report' check box.
You can automate the process of report generation
according to a schedule of your choice.
To schedule a report generation
- Select the report from the list.
The details of the report with the list of report elements will be displayed in the configuration area at the right.
- Click the 'Schedule' button at the bottom of the 'Generated Reports' area.
The 'Schedule Report' dialog will be displayed.
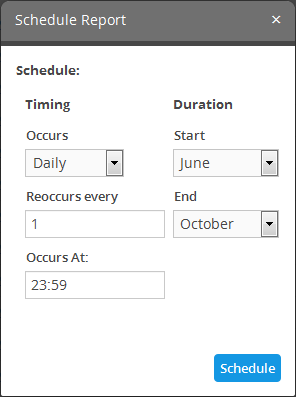
The 'Timing' section allows you to define the frequency for report generation.
- Occurs - Select the period for report generation from the drop-down.
- Reoccurs every - Enter the frequency for report generation as per the chosen days. For example, if you select 'Daily' and enter 2, then the agent will collect the logs once in every 2 days
- Occurs At - Enter the exact time at which the report is to be generated at the set days.
- Start - Select the start month from the drop-down
- End - Select the end month from the drop-down
- Click the 'Schedule' button.
A confirmation message will be displayed at the top right side of the screen. The reports will be automatically generated as per the schedule and added to the list under 'Generated Reports' and represented by time stamps under the 'Creation Time' column. You can download required report(s) by clicking the respective time stamp.