Configuring Event Queries
The 'Event Query' interface allows administrators to search for specific events using built-in queries. The administrator can also add custom 'Event Queries' according to specific requirements. You have to create conditions for a search and configure the results table accordingly to display the search results. Queries can be made to search for events that occurred during a specific time period in the selected customer's networks. The results table displays events which match the query with the fields specified for the results table as columns. The results table even allows you to perform an IP look up of external IP addresses involved in the event.
Once created, an event query can also be used for:
- Constructing custom dashboards which display query results as graphical charts. Refer to the section 'Configuring Custom Dashboard' for more details.
- Constructing 'Correlation Rules' which identify harmful events/incidents on customer networks and assign them to customer administrators for attention. Refer to the section Managing Rules for more details.
To open the 'Event Query' interface, click the 'Navigational Menu' button at top right, choose 'Investigation' then 'Event Query'.
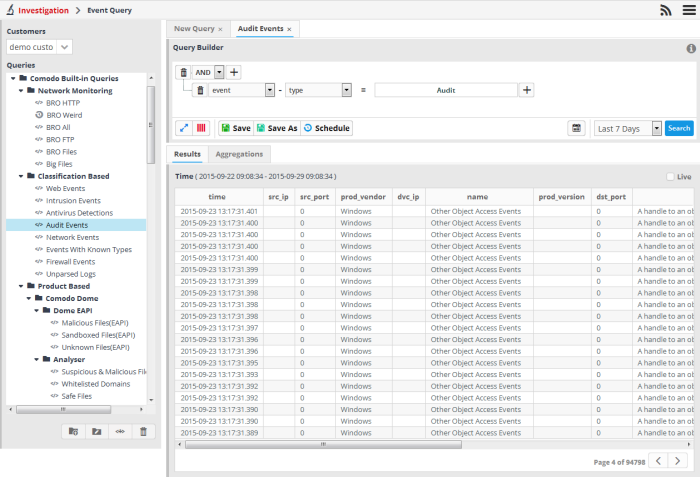
The 'New Query' tab contains a query builder which allows you to create a new query for the selected customer. Any queries you create will be added to 'Custom queries'.
|
Event Query Interface – Table of controls |
|
|---|---|
|
|
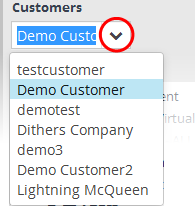
The 'Customers' drop-down allows you to select the customer for which you want to query events and/or add custom queries. |
|
|
Allows you to add a new 'Queries' folder to the left side panel |
|
|
Allows you to edit the name of a 'Queries' folder |
|
|
Allows you to a add new event query under a selected query folder |
|
|
Allows you to delete selected query folders or event queries |
|
|
Allows you to add conditions for a query. The options available from the drop-down are:
|
|
|
Allows you to expand or collapse the upper pane to view the complete list of conditions in the query. |
|
|
Allows you to configure the 'Results' table for the query displayed in the upper pane. |
|
|
Allows you to save a newly created or edited event query, configured from the upper pane. |
|
|
Allows you to save a copy of the query to a different folder or a new query created using an existing query as a template, with a different name. |
| |
Allows you to configure alerts and email notifications based on the quantity of events detected by the query within a specified period. Refer to the explanation under 'Configure duration based alerts' for more details. |
|
|
Allows you to run a query search for a specific period in the past. You can set the start end dates to search for events matching the conditions defined in the query and click the 'Search' button in the 'Advanced Search' dialog that appears on clicking this button to view the list of events. Please note the event query created for searching events in the specific period in the past using this option, cannot be saved. |
|
|
Allows you choose the time period from which events are fetched. Periods range from 1 hour to 7 days. |
|
|
Allows you to run a search operation based on the configured query. |
The interface allows administrators to:
Query folders contain collections of event queries. Every new query must be placed in a query folder.
- Choose the customer from the 'Customers' drop-down at the top of the left panel.
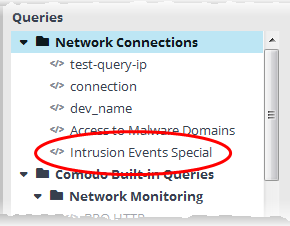
Predefined queries added for a customer are displayed in a tree structure in the 'Queries' pane.
- Choose the parent folder to create a new sub-folder and click the
button. The Folder Name dialog will appear.
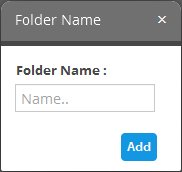
- Enter the name for the folder and click the 'Add' button
The folder will be saved and displayed on the left side
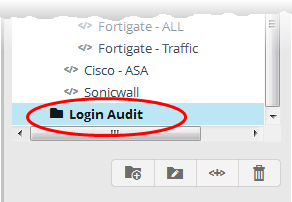
The relevant event queries can now be placed under the newly created folder. Refer to 'Manage an Event Query' for more details.
Editing a query folder
- To edit the name of a query folder, select it and click the
 button
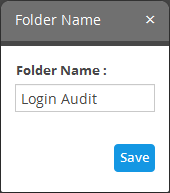
- Edit the name as required and click the 'Save' button
Deleting a query folder
- To delete a query folder, select it and click the
 button
A confirmation dialog will appear.

- Click 'Yes' in the In the confirmation dialog. Please note all event queries in the folder will also be deleted.
Event queries can be created in two ways:
An event query is built with a set of filter statements that connected by Boolean operators, 'AND', 'OR' or 'NOT'. Each filter contains the following components.
'Field Group' + 'Field' + 'Operator + 'Value'
- Field Group - The group to which the field specified as the filter parameter belongs.
- Field – The field in the event log entry by which you want to filter results
- Operator – Controls the relationship between the field and the specified value. Examples include 'Equals to', 'Does not equal to', contains, 'does not contain' etc.
- Value – The value for the field. Values can be entered manually or fetched from a pre-defined list which is managed in the Live List Management' interface. For example, if you choose a source IP (src_ip) as the field to be searched from network events, you can manually enter the IP address of the source of the connection request or choose a Live List containing a list of specified source IP addresses.
When the query is run, events will be fetched from the database and checked against the filter statements one by one.
Examples:
-
To search for network connection events originated from an endpoint with IP address 10.100.100.100, build the filter statement as shown below:
'Source' + 'src_ip' + '=' + '10.100.100.100'
-
To search for network connection events originated from a set of endpoint whose IP addresses start with 10.100.100.xxx, build the filter statement as shown below:
'Source' + 'src_ip' + 'AB*' + '10.100.100
-
To search for network connection events originated from a set of endpoint whose IP addresses are defined in the 'Live List type' named 'Internal' under the 'Live List' named 'IP Blacklist' build the filter statement as shown below:
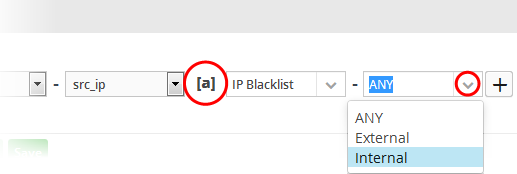
'Source' + 'src_ip' + '[a]' + 'IP Blacklist' + 'Internal'
You can create more complex queries by adding more filter statements and linking them using 'AND', 'OR', or 'NOT'. For example:
-
To search for network connection events originated from an endpoint with IP address 10.100.100.100, and destined to another endpoint with IP address 10.100.100.120, build the filter statements with an AND combination as shown below:
'Source' + 'src_ip' + '=' + '10.100.100.100'
AND
'Destination' + 'dst_ip' + '=' + '10.100.100.120'
To add a new event query for a customer
- Select the customer from the 'Customers' drop-down at the top of the left hand side panel.
- Select the appropriate folder or create a new query folder under which you want to create an event query. Alternatively, you can also select a folder while saving a query.
- Click the
 button
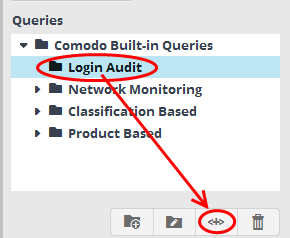
A 'New Query' tab will be displayed.
|
Tip: You can also use the 'New Query' tab that is displayed as the first tab on selecting a customer, to create a new query. You can save the created query by selecting an appropriate folder from the left side panel. |

The next step is to add the filters for the query.
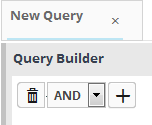
- Choose the combination condition for the query filter statements to be defined from the drop-down in the 'Query Builder' pane. The options available are:
- AND
- OR
- NOT
- Click the
button
The 'Field Groups' drop-down and 'Fields' drop-down will appear. The 'Fields' drop-down will contain options relevant to the 'Field Group' chosen from the drop-down at the left.
- Choose the field group you wish to add to the filter from the 'Field Groups' drop-down.

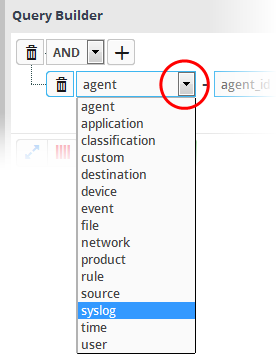
The next field will display the fields available for the selected field group.
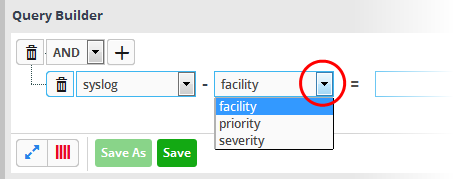
|
Tip: The descriptions of the Field Groups and the Field items under each of them, are available in Appendix 1 - Field Groups and Event Items Description. |
The next step is to choose the relationship operator between the two fields.
- To choose an operator, click the drop-down between the two fields:
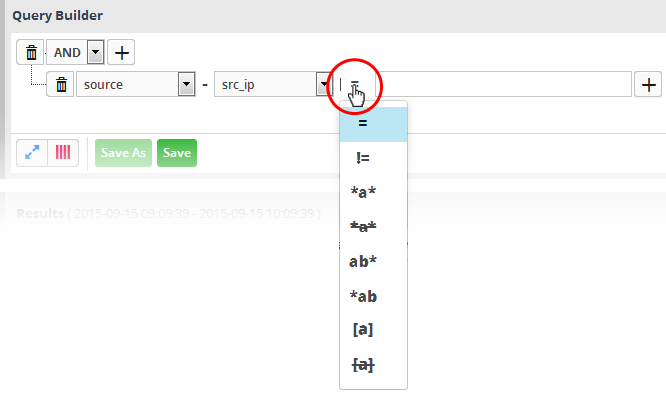
- Choose the relation from the options and enter/specify the value for the field.
The types operators depends on the field chosen. The following table explains the various operator symbols:
|
Relation Operator |
Description |
Entering the value for the 'Field' |
|---|---|---|
|
|
Equals to |
Manually enter a value in the field to the right of the operator. |
|
|
Does not equal to |
Manually enter a value in the field to the right of the operator. Events that do not contain the value will be identified by the query. |
|
|
Greater than |
Applicable only for fields with numerical values, for example, port numbers. Manually enter a value in the field to the right of the operator. The query will identify events that contain values greater than the entered value. |
|
|
Greater than or equal to |
Applicable only for fields with numerical values, for example, port numbers. Manually enter a value in the field to the right of the operator. The query will identify events that contain values equal to or greater than the entered value. |
|
|
Less than |
Applicable only for fields with numerical values, for example, port numbers. Manually enter a value in the field to the right of the operator. The query will identify events that contain values less than the entered value. |
|
|
Less than or equal to |
Applicable only for fields with numerical values, for example, port numbers. Manually enter a value in the field to the right of the operator. The query will identify events that contain values equal to or lower than the entered value. |
|
|
Contains |
Manually enter a value in the field to the right of the operator. The query will identify events that contain the entered value somewhere in the string. For example, to search for events with source IP addresses containing 123 anywhere in the address, enter '123'. |
|
|
Does not contain |
Manually enter a value in the field to the right of the operator. The query will identify events that do not contain the entered value anywhere in the string For example, to search for events with source IP addresses that do not contain 123 anywhere in the address, enter '123'. |
|
|
Starts with |
Manually enter a value in the field to the right of the operator. The query will identify events that begin with the entered value. For example, to search for events with source IP addresses starting with 192, enter '192'. |
|
|
Ends with |
Manually enter a value in the field to the right of the operator. The query will identify events that end with the entered value. For example, to search for events with source IP addresses that end with 123, enter '123'. |
 |
Is Empty | Searches for events in which the selected field is empty (does not contain any value). For example, to search for the events with no values in their source IP address fields, select 'Is Empty'. |
 |
Is Not Empty | Searches for events in which the selected field is not empty (contains a value of some kind). For example, to search for the events with some IP addresses values in their source IP address fields, select 'Is Not Empty'. |
|
|
Is in List |
Allows you to configure the filter statement to fetch values for the field from a pre-defined live list containing specific values for the field type. Background: Live Lists enable administrators to add and manage lists of values for different fields for use in queries and correlation rules. Lists can be created and the values can be updated manually or configured to be fetched from outputs of correlation rules. The updates in a list will be immediately reflected in the queries and the rules in which it is used, relieving the administrator from the burden of updating queries and rules for change in values to be queried. For more details on Live Lists management, refer to the section Live Lists. On selecting
The first drop-down shows the Live Lists that contain values for the selected query field. The second drop-down shows the List Types within the selected 'Live List'.
All the values contained in the list will be included as values for the Field specified in the filter statement. |
|
|
Not in List |
Allows you to configure the filter statement to search for the events that do not contain specific values from a pre-defined live list . On selecting
The first drop-down shows the Live Lists that contain values for the selected query field. The second drop-down shows the List Types within the selected 'Live List'.
The results will display all events that do not contain the values in the live lists. |
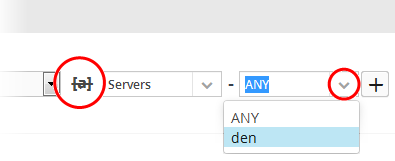
If you are adding values for source parameters like source IP address, source port, source MAC etc., but wish to reverse the parameter, click the switch icon  that appears to the right of the statement. The field group and the field selected will automatically switch from source to destination or vice-versa.
For example, if you are specifying a live list containing values of source IPs for the source IP field, but want to change them to destination IPs, you can click the switch button. 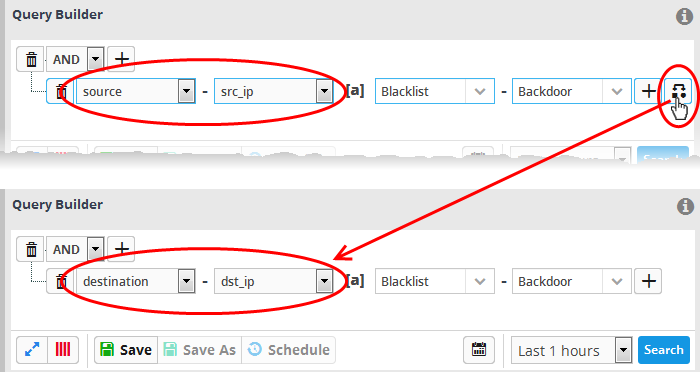
- To add a sub-filter statement, click the
 button beside the filter and repeat the process.
- To set the relationship between each statement, use the drop-down menu.
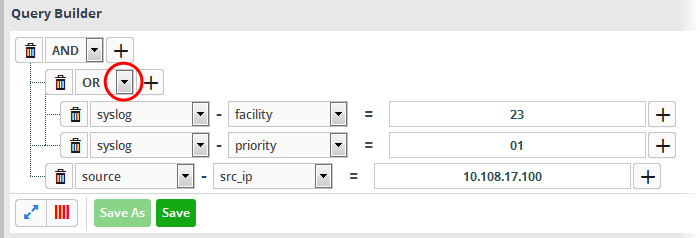
- For example, the query below will return events whose source ends with 10.100 OR .com AND whose destination is 86.105.227.125
|
Tip: You can update and refine a query by adding more filters once you have seen the results. Refer to the section Updating a Query for more details. |
- To add more filter statements to the query, click the
 button and repeat the process.
- To delete a filter, click the
button beside it.
- Click the 'Save' button in the 'Query Builder' screen.

- Enter the name of the query in the 'Query Name' field and click the 'Save' button
The 'Event Query' will be saved under the selected folder and displayed.
|
Note: If you didn't select a folder in the first step you will be asked to do so when saving the query. |
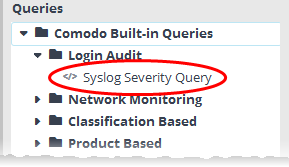
The next step is to run the event query. Before that, however, the 'Results' table must be checked and configured so that it is relevant to the event query. Refer to 'Configure Results Table for a Query ' for more details.
Creating a new query using an existing query as a template
You can select a pre-defined query and modify its parameters to create a new query.
To create a query from an existing query
- Select the customer from the 'Customers' drop-down at the top of the left hand side panel.
- Select the query from the list of queries in the left panel.
The query will be expanded under a new tab in the right side panel.

- Add or remove the query conditions and/or edit the parameters in the existing conditions. The process is same as creating a new condition as explained above.
- Select the folder in which the new query is to be saved.
- Click 'Save as' from the 'Query Builder' pane.
The Query Name dialog will appear.
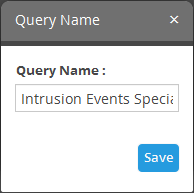
- Enter a new name for the query and click 'Save'.
The 'Event Query' will be saved and displayed under the selected folder.
The next step is to run the event query but before that the 'Results' table must be checked and configured so that it is relevant to the event query. Refer to 'Configure Results Table for a Query' for more details.
Configure Results Table for a Query
In order to display the event fields relevant to a specific query, the 'Results' table must first be configured.
- Select an event query from the left side and click the
 button from the 'Query Builder' pane.
The 'Result Fields Selection' dialog will be displayed.
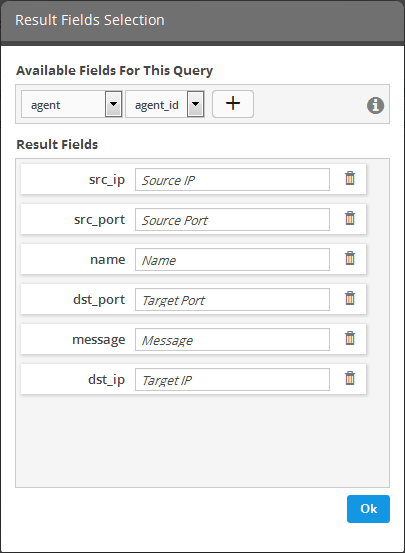
The same 'Field Groups' and 'Fields' used for in the 'Query Builder' will be available for inclusion in the results table. By default a set of 'Result Fields' relevant to the query will be displayed.
- To add new 'Result Fields', click the 'Field Groups' combo box and select the field group.
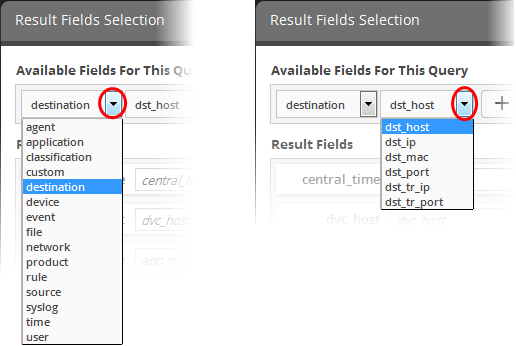
The next field will display the items available for the selected field group.
- Select the required field from the drop-down and click the
 button.
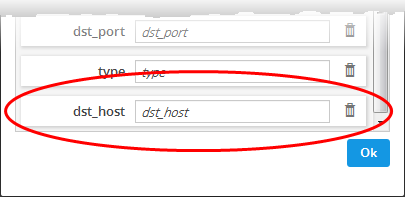
- Enter a name for the field, by which the field should be displayed in the 'Results' screen.
- Repeat the process to add more fields and click 'Ok'
- To remove irrelevant fields, click the trash can icon
beside it.
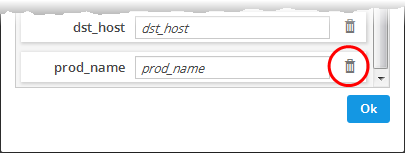
- Click the 'Ok' button
- Click the 'Save' button in the 'Query Builder' screen to save your changes.
Configure Duration Based Alerts
NxSIEM dynamically monitors customer networks for events based on used-defined queries. Administrators can configure queries to generate alerts if the number of events exceeds or falls below a certain threshold in a certain time-period.
Examples - administrators can request alerts if the number of events matching a query exceeds 1000 in 10 minutes, or if no events are detected for a query for 15 minutes.
Alerts can be configured to send notification emails to the administrator and/or set to generate an 'Incident' which is assigned to a user. For more details on Incidents, refer to the section Managing Incidents.
To schedule a query to generate alerts
- Select a saved event query from the left side and click the 'Schedule' button
from the 'Query Builder' pane.
The 'Schedule Info' dialog will be displayed for the selected query.
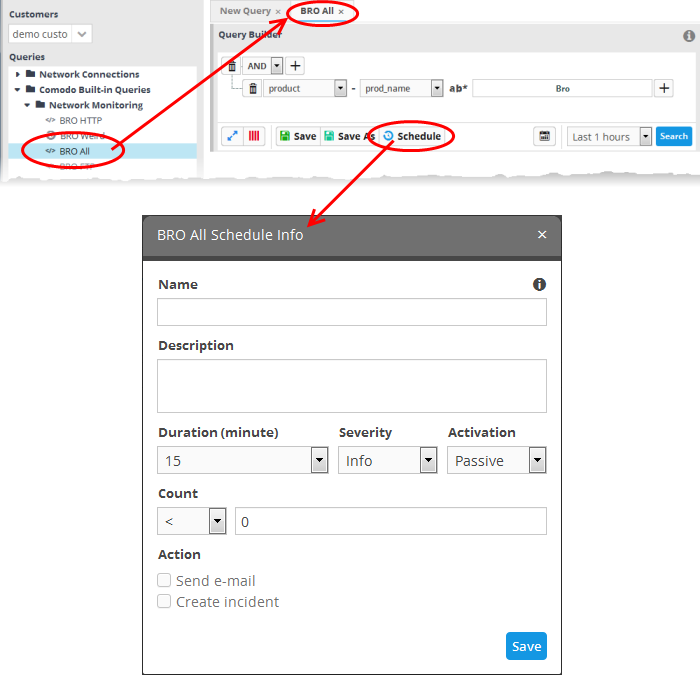
- Name – Enter a name to identify the schedule
- Description – Enter a short description for the schedule
- Duration – Enter the time period specified for monitoring the number of events matching the query, in minutes.
- Severity – Select the severity level for the alert to be generated by the schedule
- Activation – Specify whether the schedule is to be activated or not from the drop-down. You can switch the activation state of a schedule at any time from the 'Schedule Info' dialog.
- Count – Set the threshold for the number of events.
- > - Will generate an alert if the number of events detected in the specified 'duration' exceeds the value in the text field.
- < - Will generate an alert if the number of events detected in the specified 'duration' is lower than the value in the text field
- To generate an alert if no events are detected within the specified duration, choose less than and enter 'zero' ('<' and '0')
- Action – Choose how NxSIEM should react if the alert's conditions are triggered.
- Send e-mail – NxSIEM sends a notification email to the administrator if the conditions are met
- Create Incident – An incident is created and assigned to a user to investigate. Refer to the section Managing Incidents for more details.
- Click 'Save' in the Schedule Info dialog to save the schedule.
The event query added with a schedule.
-
To edit a schedule of a query or switch the schedule between 'active' and 'inactive' states, select the query from the list at the left, click the 'Schedule' button, change the values in the 'Schedule Info' dialog and click 'Save'.
Saved event queries can be run at anytime to obtain a list of matching events within a chosen period of time. The results can be viewed in two ways:
- As a results table with columns selected as explained above. You can view the full details of any event in its 'Details Pane' containing values for all the fields in the log entry. The Details pane also allows you to add values of selected fields to Live Lists for use in new event queries and correlation rules. You can also run look-ups of IP addresses and domains involved in the event. More explanations are available under 'View Results Table'.
- As aggregations of results, with identified events grouped based on selected event field(s) and the resultant event groups ranked based on specified aggregation function. More explanations are available under View Aggregated Results.
To run an event query
- Select an event query from the left.
- Select the period for which you want to run the query.
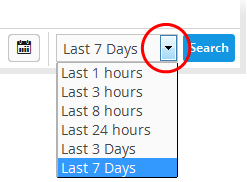
- To view recent events, select the period from the drop-down at the bottom right of the 'Query Builder' pane and click the 'Search' button. Options range from the last hour to the last 7 days.
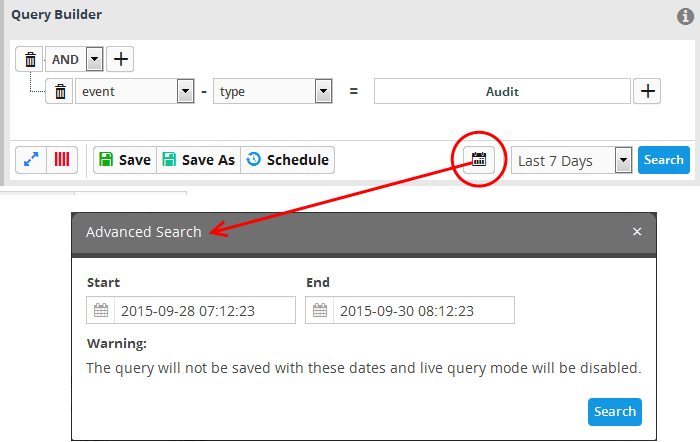
- To view the events occurred within specific dates, click the calendar button, enter the 'Start' and 'End' dates of the period in the 'Advanced Search' dialog and click 'Search'.
The 'Results' are displayed in the lower pane.
- Select the 'Live' check box to search streaming data for the event query.
|
Note: The 'Live' option will not be available for advanced search made for period between start and end dates. |
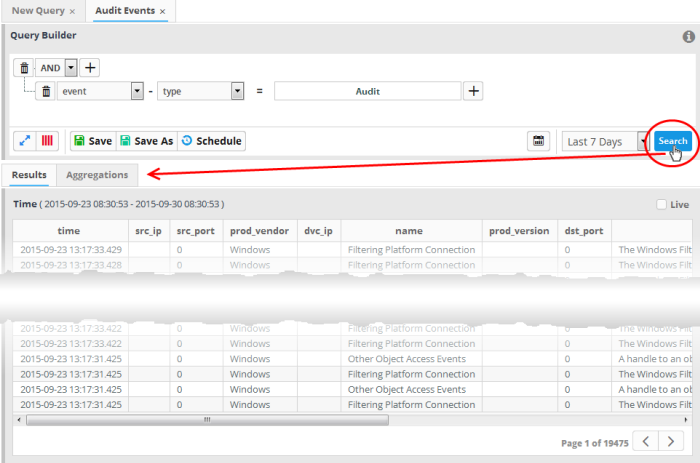
The lower pane has two tabs:
- Results – The 'Results' tab displays log entries that match the query with the selected event fields as column headers (explained above. Clicking on an event allows you to view its details. More details on the 'Results Table' are available under 'View Results Table'.
- Aggregations – The Aggregations tab allows you to group identified events and view aggregation results. More details on aggregations are available under 'View Aggregated Results'.
After running a query, the 'Results' tab is opened by default in the lower pane. You can click the 'Results' tab to view the results table if you are currently viewing the aggregation results.
The 'Results' tab contains a table of event log records that match the event query. The event fields form the table columns. Events can be created in the Query Builder pane. Refer to the explanation of 'Configure results table for a query' for more details.
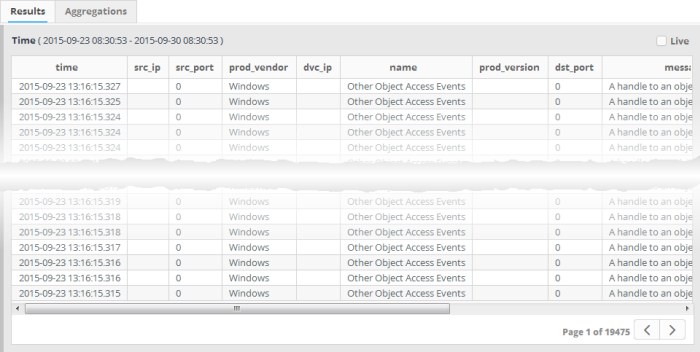
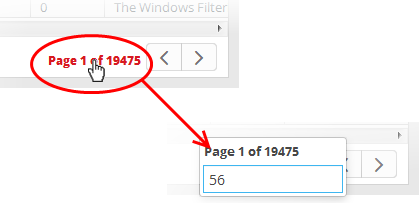
Each page in the 'Results' table displays 20 entries. You can navigate to successive pages using the left and right arrows at the bottom-right. To open a specific page, click the page number at bottom-right then enter the page number in the text box:
You can view complete details of an event log entry from the 'Results' table and use the values to add further filters statements to the query in order to refine the search. You can also perform IP and Domain lookups and feed these values to live lists for use in other queries and correlation rules.
- To view the details of an event, click on the result row.
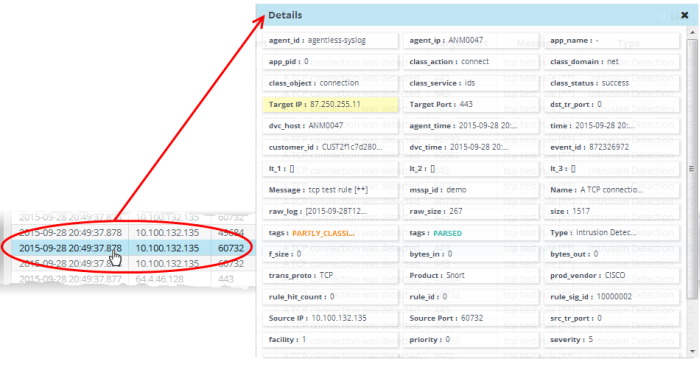
External IP addresses and domain names are highlighted in yellow.
- Clicking on a field adds the field with its value as a filter statement to the query, enabling you to refine your search for events that contain the same value in the respective field and/or to create a new query. Refer to the explanation under Update and Refine Queries from results for more details.
- If you click the gear icon that appears when you hover your mouse over a field you will see a context sensitive menu:
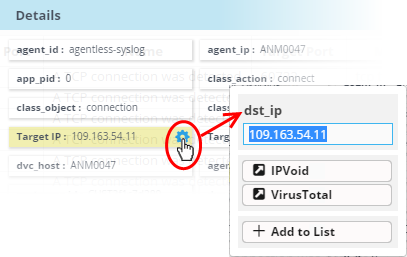
From the context sensitive menu, you can:
Performing IP Lookup of External IP Addresses using IPVOID
You can view the scan report containing IP address information and IP Blacklist Report for any external IP address detected in an event. The 'Details' pane of an event query result displays the detected external IP address field in yellow, which acts as a shortcut to perform the IP Look up through IPVOID website.
To perform IP Look up of External IP address
- Click on the event involving connection to an external network or host from the results table to open its 'Details' pane.
The fields containing external IP address(es) are highlighted in yellow as shown in the example below.
- Hover the mouse cursor over the field and click on the gear icon that appears at the right.
- Click on the 'IPVoid' option.
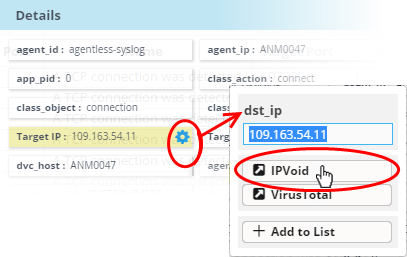
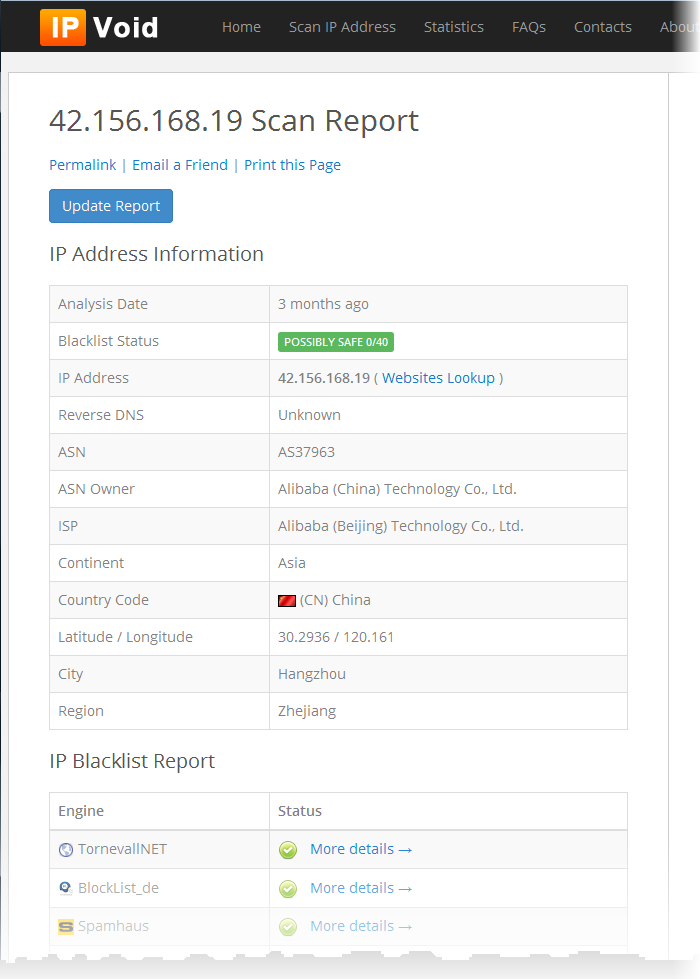
You will be taken to the IP VOID webpage containing the scan results of the IP address.
An example is shown below.
Performing IP Address/Domain Lookup using Virus Total
You can view the IP address information/Domain information for external IP addresses/domains detected in an event from the 'Virus Total' website. The 'Details' pane of an event query result displays the fields containing external IP address/domain names field in yellow, which acts as a shortcut to perform the look up.
To perform IP/Domain Look up using Virus Total
- Click on the event involving connection to an external network or host from the results table to open its 'Details' pane.
The fields containing external IP address/Domain name are highlighted in yellow as shown in the example below.
- Hover the mouse cursor over the field and click on the gear icon that appears at the right.
- Click on the 'Virus Total' option.
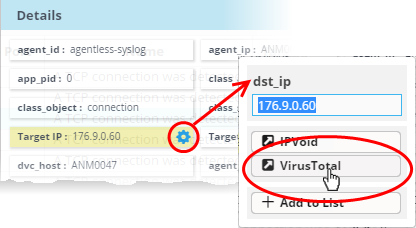
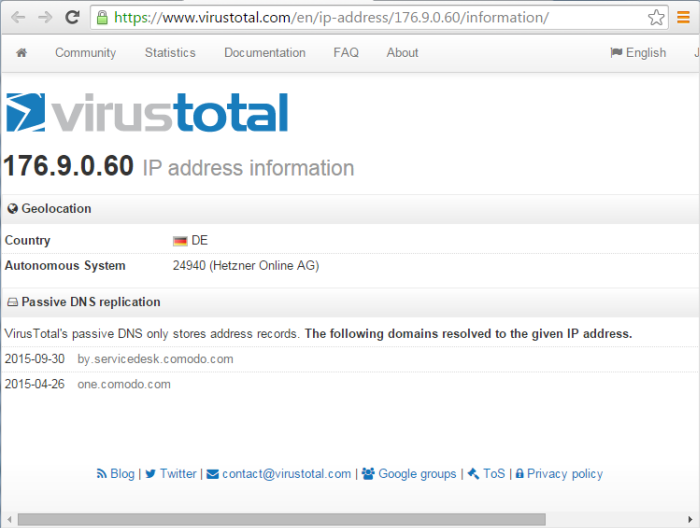
You will be taken to the Virus Total webpage containing the information on the IP address/domain.
An example is shown below.
Adding Field values to Live Lists from Results
You can add values for certain fields detected in an event to Live Lists defined in NxSIEM, for use in other queries and correlation rules.
|
Background Note on Live Lists: Live Lists enable administrators to add lists of values for fields used in queries and correlation rules. Lists can be updated manually or configured to fetch values by a correlation rule. List updates will be immediately reflected in the queries and the rules in which it is used, relieving the administrator of the burden of updating them manually. For more details on Live List management, refer to Live List. |
To add a field value from an event to a live list:
- Click an event on the results table to open its 'Details' pane.
- Hover the mouse cursor over the field containing the value to be added to a list and click on the gear icon that appears at the right:
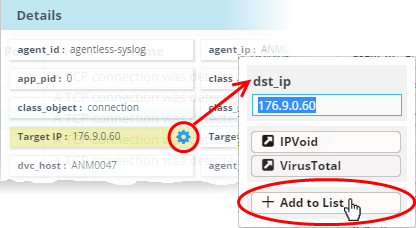
- Click on the 'Add to List' option.
The 'List Content Add' dialog will appear. The 'Value' field in the dialog is pre-populated with the chosen value.
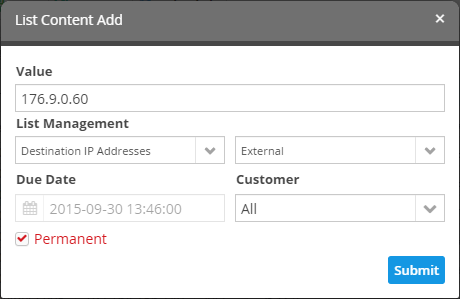
- Select the Live List and the list type to which the value is to be added, from the respective drop-downs under 'List Management'.
- Enter the date till which the value is valid in the Due Date field. You can click the calendar icon at the left of the field and choose the date. On the specified date, the value will be automatically removed from the list. If you want the value to be permanently valid, select the 'Permanent' checkbox.
- Select the customer to which the value is applicable from the 'Customer' drop-down.
- Click 'Submit'.
The value will be added to the respective List Type and all the queries and correlation rules in which the list is deployed, will be updated immediately.
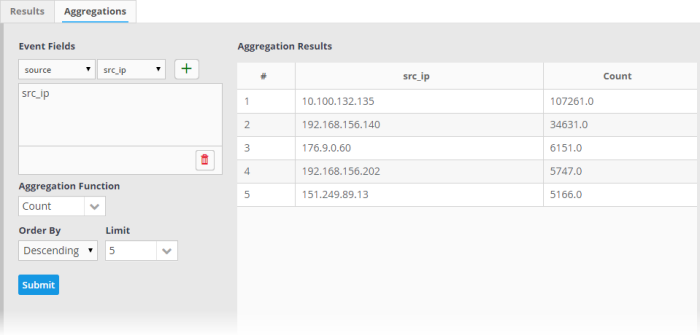
The 'Aggregations' tab allows you to aggregate responses from an event query and to view aggregated results. Events can be grouped based on values of selected fields to form event groups. Event groups can then be ranked based on the aggregation function selected and results can be viewed in ascending or descending order according to rank.
To view the aggregation of events
- Click the 'Aggregations' tab in the lower right pane of the 'Event Query' interface
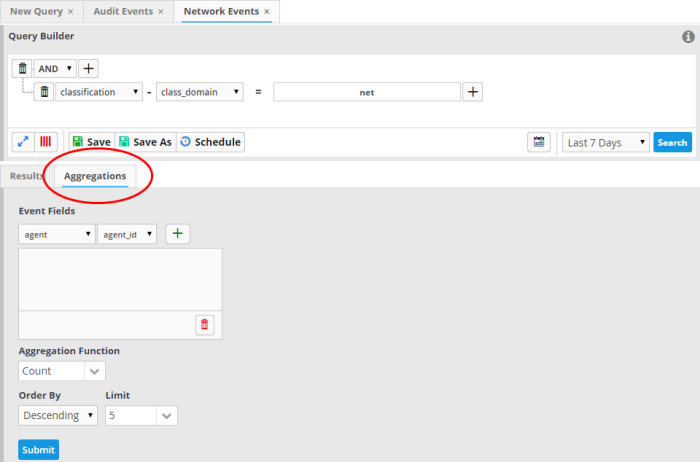
Aggregating events involves four steps:
Step 1 – Select the event field(s) on which events are to be grouped
The first step is to choose the event fields by which the events should be grouped. Event groups will be formed so that each event group will have events with same value for the selected field. If you select more than one field, the combinations of values in the selected fields will be taken into account for grouping.
To select the event field(s) for grouping
- Choose the 'Field Group' from the first drop-down under 'Event Fields'
The next drop-down will be populate with the fields belonging the chosen group
- Choose the 'Field' from the second drop-down and click the
button.
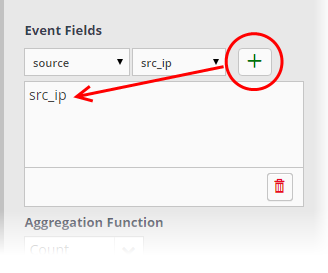
- Repeat the process to add more fields for grouping.
Step 2 – Select the aggregation function
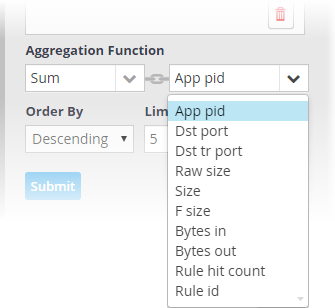
The event groups formed based on the fields chosen in the first step are ranked based on the function chosen from the 'Aggregation Function' drop-down. The available options are:
- Count – The event groups are ranked based on the number of events in each group. For example, if you choose Source IP as 'Field' then the group which contains the most events on a particular source IP will have the top rank and the group containing the lowest number of events is ranked lowest. You can further control how the data is displayed by modifying the ‘Order By’ and ‘Limit’ parameters.
- Sum – The event groups are ranked based on sum of values in another field that contains numerical value. If you choose 'Sum', you need to select another field that contains a numerical value, like source/destination port or bytes in/out. The event groups are ranked based on the sum of the values in the chosen numerical field from all the events in that group. For example, if we choose 'Bytes-in' as numerical value, then the system adds up the values in the 'Bytes-in' field of all the events in a group and ranks the group accordingly. This will tell you which source IP has the most incoming traffic. The event group with the highest SUM in the 'Bytes-in' field is ranked top and vice-versa.
- Average – Similar to above. The event groups are ranked based on the average of the values of chosen numerical field from all the events in that group. (e.g. the average of values of src_port field of events in the group, if we take the same example as above)
- Minimum – Similar to above. The event groups are ranked based on the minimum of the values of chosen numerical field from all the events in that group.
- Maximum – Similar to above. The event groups are ranked based on the maximum of the values of chosen numerical field from all the events in that group.
To set the aggregation function
- Choose the function from the 'Aggregation Function' drop-down.
- If you choose 'Sum', 'Average', 'Maximum' or 'Minimum', then you should choose an item which is it useful to measure. For example, 'Bytes-in' can be measured and is suitable for the Sum, Average, Max and Min functions. On the other hand, there would be little value in applying these functions to destination port numbers.
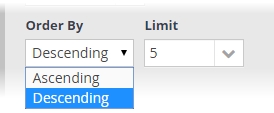
Step 3 – Select the order of ranking based on which you want to see the aggregation results
You can choose how event groups should be ranked from the 'Order By' drop-down. The available options are:
- Ascending - The group with the lowest rank will be top of the list. A limit of 5 will show the 5 groups with the lowest ranks.
- Descending - The group with the highest rank will be top of the list.. A limit of 5 will show the 5 groups with the highest ranks.
Step 4 – Set the limit for number of results to be displayed
The last step is to set a limit for the number of event groups to be displayed as aggregation results in ascending or desceding order as chosen in the previous step.
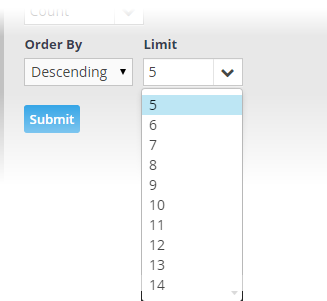
- To set the limit, choose/enter the number of results to be displayed, in the 'Limit' drop-down combo box.
- Click 'Submit'.
The results will be displayed in the Aggregation Results pane at the right.
Event queries can be updated and refined at any time from the Event Query Interface. For example, you may wish to add new filters or to remove filters that offer little value.
To update a query
- Select the customer from the 'Customers' drop-down at the top of the left hand side panel.
- Choose the query to be updated, from the 'Queries' list at the left.
The Query with its filter statements will be displayed in a new tab at the right panel
- To delete a filter , click the
button beside it.
- To add a new filter, follow the process explained in the section Creating a New Event Query.
To refine the query by adding a new filter(s) from the results
- Run the query as explained in the section Run an Event Query
The Results will be displayed in the lower pane under the 'Results' tab

- Click on the result, to view its details, from which new filters are to be added to the query.

The 'Details' pane will appear for the event log entry, with values for all the fields.
- Click on the field, to be added as a filter with its value as shown in the result, to the query.
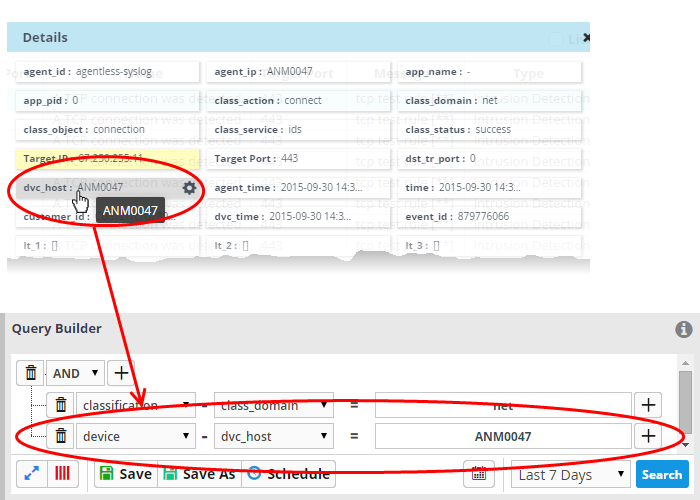
A new filter will be added with the parameter contained in the field chosen from the 'Details' pane
- To save the query with the new filter, click 'Save'.
- To create a new query with the existing and newly added filters, leaving the existing query unchanged, select the category folder from the left click 'Save as' and save the new query with a new name.


