


Step 5 - View Alerts
Alerts are created when an event on your network matches a rule in your EDR policy. See 'Manage EDR Policies' if you want to learn about policies and rules.
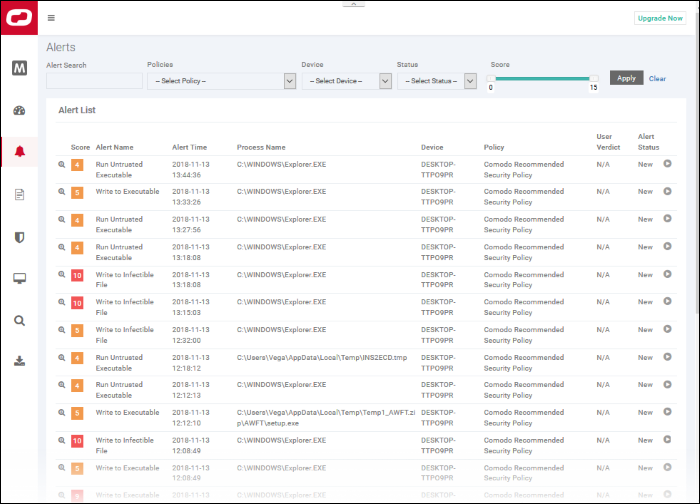
- Click 'Alerts' on the left to open the interface:
|
Alerts - Table of Column Descriptions |
||
|---|---|---|
|
Column Header |
Description |
|
|
Score |
The rating you specified for the event when creating the rule. You can apply a score between 0 and 10 based on the severity you place on the event. See 'Manage EDR Policies' for more information. |
|
|
Alert Name |
The label you gave to the condition when creating the rule. Alerts are generated when rule conditions are triggered. See 'Manage EDR Policies' for more information. |
|
|
Alert Time |
The date and time the warning was generated. |
|
|
Process Name |
Path of the application that caused the event. |
|
|
Device |
The name of the endpoint on which the event was logged. |
|
|
Policy |
The name of the security policy that created the alert. |
|
|
User Verdict |
The status assigned to the alert by the admin who dealt with the issue. Options include:
Note - The comments will not appear in the list of user verdicts |
|
|
Alert Status |
Progress of the alert. Statuses include:
|
|
Filter options
You can search for particular alerts using the following filters:
- Alert Name – Search by alert label.
- Alert Time – Search by when the alert was generated.
- Process Name – Search by process name
- Devices – Select the device on which the event occurred
- Policy – Filter by policy that triggered the alert
- User Verdict – Filter by status awarded to the alert by an admin.
- Alert Status – Filter by any of the 3 progress levels – 'New', 'In progress' or 'Resolved'.
- Enter / select the filter and click 'Apply'
- Click 'Clear' to remove the search filters
You can configure multiple filters to search for a particular alert. For example, you can search for an event by its alert name, policy and the endpoint.
- Click the play icon beside the 'New' alert status to submit the verdict.
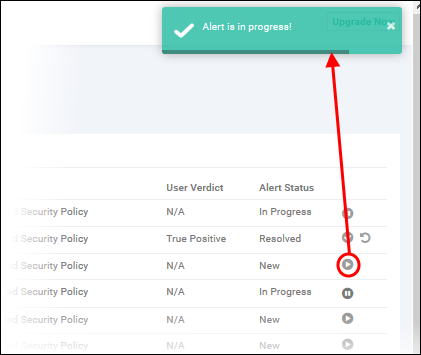
The alert status will change to 'In progress'.
- Click the progress icon to submit the verdict
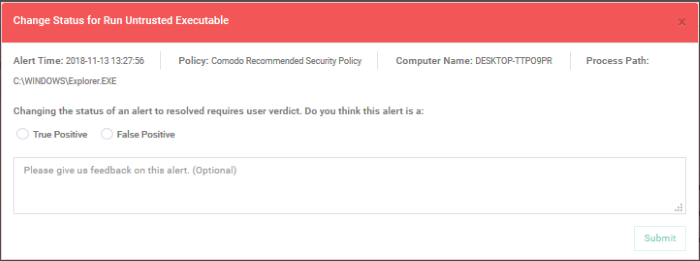
- Click 'Submit' to resolve the alert
- Click the reopen icon if you want to change the verdict.
- Click 'Yes, reopen it!' to change the verdict
- Click 'Cancel' to keep the verdict unchanged
View Event Details
- Click 'Show Details' in the 'Score' column:
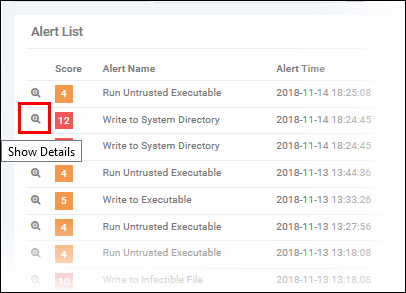
This open the information screen for that event:
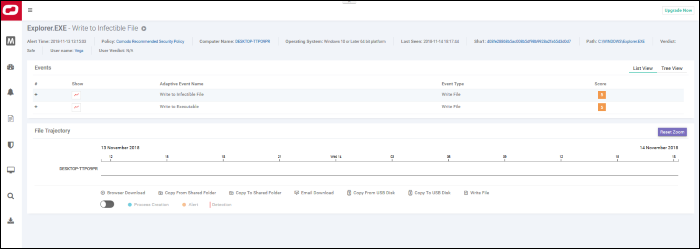
The top part of the screen shows details such as the alert name and the application that generated the event:

- Alert and application name is shown at the top
- Alert Time – Date and time of the alert
- Policy – Name of the security policy. Click the name of the policy to open the policy management screen. See 'Manage EDR Policies' for more information.
- Computer Name – Name of the endpoint from which the event was logged. Clicking the endpoint will open the 'Computer Search' screen with the endpoint preselected. See 'Computer Search' for more details.
- Operating System – Details of the endpoint's OS from which the event was logged.
- Last Seen – The last date and time the endpoint communicated with EDR.
- Sha 1 – The hash value of the file. Clicking the hash value will open the 'Hash Search' screen with the file preselected. See 'Hash Search' for more information.
- Path – The full process path of the event that was logged. Clicking the process path will open the 'Event Search' screen with the event query auto-filled in the search field. See 'Event Search' for more details.
- Verdict – Valkyrie results after the analysis.
- User name – The logged in user name of the endpoint. Clicking the name will open the 'Event Search' screen with the event query auto-filled in the search field. See 'Event Search' for more details.
- User
Verdict – The admin's conclusion on the nature of alert. The
options given to declare the results are 'True Positive' and False
Positive'.
Events
Details of the event are shown in the main pane:
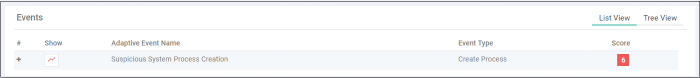
- You can view the event details in list and tree views.
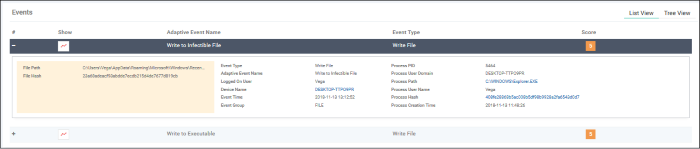
- Show - Click
icon to view event timeline. See 'Process Timeline' for more details. Click anywhere on the row to display all the event fields for that event type. The number of event fields displayed depends on the event type.
- Adaptive Event Name – Label given to the event when creating the security rule.
- Event Type – The category of event
- Score – The event severity. This was specified when the rule was created.
- Click anywhere in the row to view all event fields for that event type. The number of event fields shown depends on the event type:
- Tree View
- Click 'Tree View' link at top-right of 'Events' section
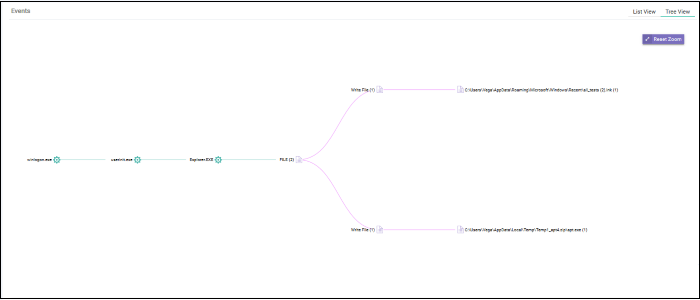
The screen shows the full process path of the event. Click any process label to open the 'Event Search' screen with the event query auto-filled in the search field. See 'Event Search' for more details.
- Zoom in or out using your mouse. Right-click and move the chart left or right. Click 'Reset Zoom' to return to default view.
Process Timeline of the Event
Shows
the  various activities happening in an event for each file type.
Timeline
View
- Click the 'Show in Process Timeline' icon of the event
The 'Process Timeline' screen will open.
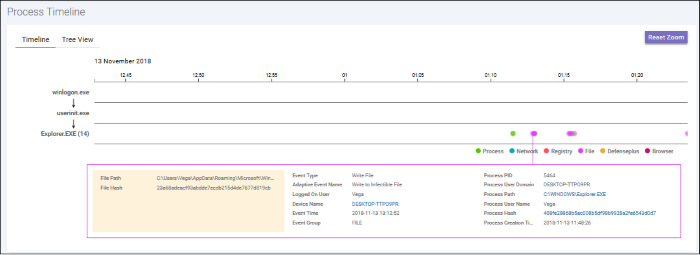
The screen shows the time at which each event occurred. See 'Process Timeline' for more details.
Tree View
- Click the 'Show in Process Timeline' icon of the event
- Click 'Tree View'
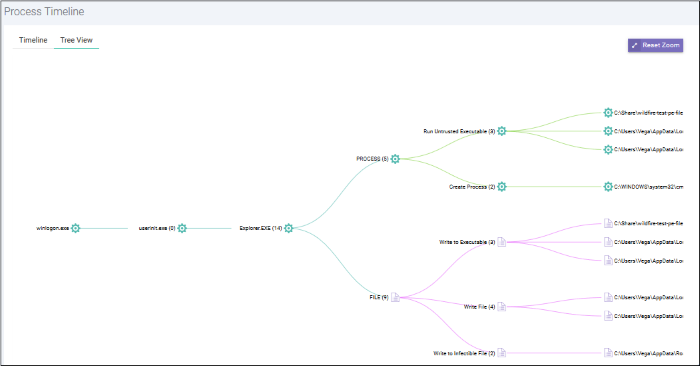
The screen shows the tree view of the event occurrences. See 'Process Timeline' for more details.
File Trajectory
The bottom section of the screen
displays the movement of the file, that is from where it was
downloaded, copied to which endpoint and so on.
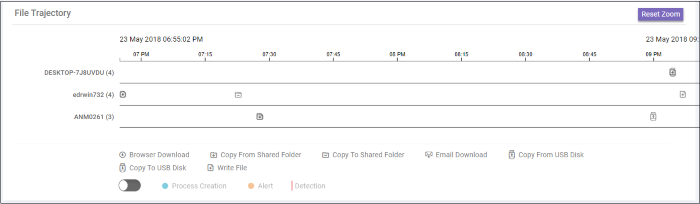
- Zoom in or out using your mouse. Right-click and move the chart left or right. Click 'Reset Zoom' to return to default view.
- Details of the icons is shown below the graph.
- Click an icon to view the trajectory details.
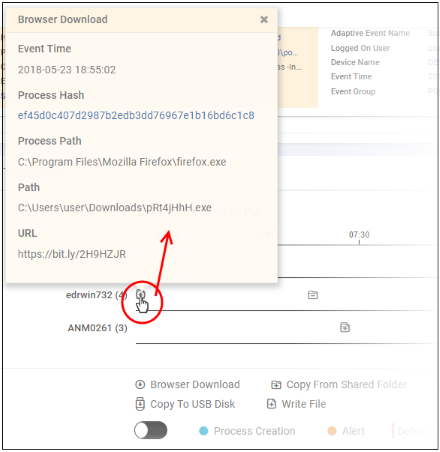
- Click 'X' to close the dialog.
- Click 'Process Creation' button to view time of process creation, event detected and alert generated.
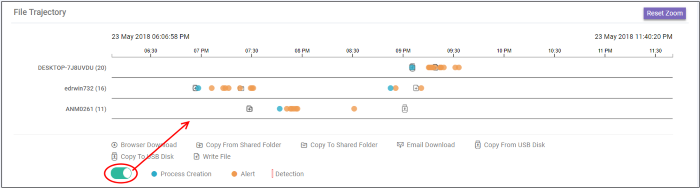
- Click an icon color code to view trajectory details.
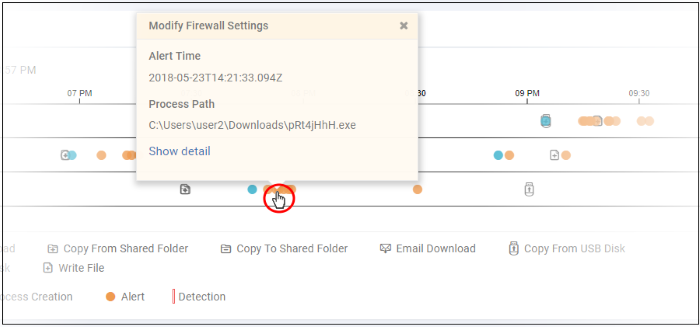
- 'Show detail' link will be available for Alert dialog. Clicking the link will open the event details screen for which the alert was generated.
- Click 'X' to close the dialog.
See 'Alerts' for more information.