Hash Search
- A hash search allows you to locate files by their MD5 or SHA-1 hash value. Visibility, execution trend, file history and execution summary are listed for each file.
- Unlike the 'Event' and 'Computer' interfaces, you cannot simply search for a hash. You must either (i) copy and paste a hash value from the dashboard, detection or event search interfaces (ii) click a hash-value link in various screens such as the dashboard or 'Computer Search' screens. The latter will auto-populate the search interface.
- Click 'Investigation' on the left then 'Hash Search' to open this interface.
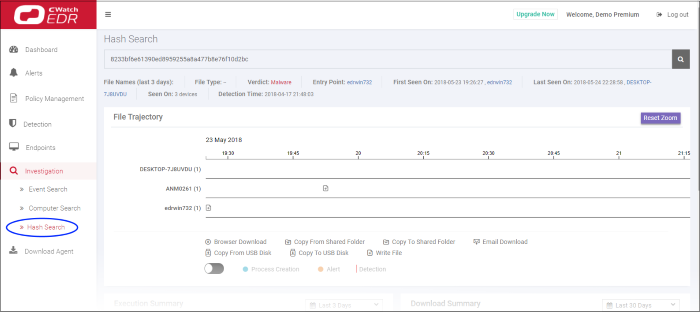
- Enter the hash value of the file you wish to analyze. Hash values of malware and safe files can be copied from various interfaces such as:
- 'Dashboard' > 'Malware & Suspicious Activity' tile > under 'Most Found Malware' and 'Last Found Malware'
- 'Detection' > in the 'Sha1' column
- 'Investigation' > 'Event Search' > in the 'Process Hash' column
- Click a hash value on any of the screens above to automatically populate the search box here.
- Use the time-range drop-down to show event information for a specific date or date-range (applies to 'Execution Summary', 'Download Summary', 'Creation Summary' and 'Execution Trend' tiles).

- File Name – Hash value's file name
- File Type – The nature of file. For example, an executable.
- Verdict - Displays the file's trust rating after EDR analysis.
- Entry Point - The name of the device on which the file was first detected. Clicking the device name will open the 'Computer Search' screen with the device name auto-populated in the search box.
- First Seen On - The date and time of the event was first logged and the name of the device on which it was detected. Click the device name to open the 'Computer Search' screen with the device name auto-populated in the search box.
- Last Seen On - The date and time of the last event logged for the same file and the name of the device on which it was detected. Click the device name to open the 'Computer Search' screen with the device name auto-populated in the search box.
- Seen On - The number of devices on which the file was found.
- Detection Time - The date and time the trust verdict was awarded to the file. This may be some time in the past if Valkyrie has already encountered the file and has a database entry for it.
The first tile below the hash file
info screen displays the movement of the file, that is from where it
was downloaded, copied to which endpoint and so on.

- Zoom in or out using your mouse. Right-click and move the chart left or right. Click 'Reset Zoom' to return to default view.
- Details of the icons is shown below the graph.
- Click an icon to view the trajectory details.
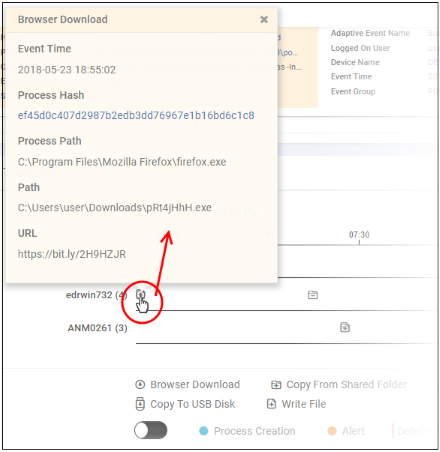
- Click 'X' to close the dialog.
- Click 'Process Creation' button to view time of process creation, event detected and alert generated.

- Click an icon color code to view trajectory details.
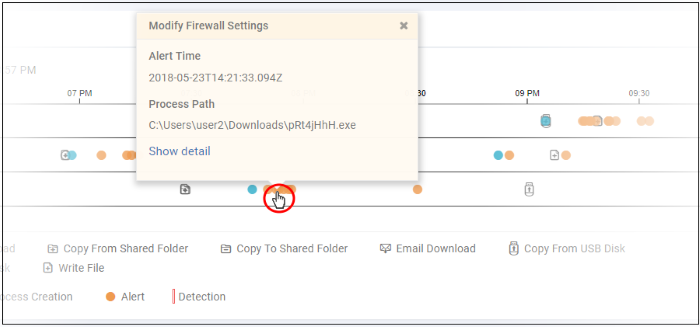
- 'Show detail' link will be available for Alert dialog. Clicking the link will open the event details screen for which the alert was generated.
- Click 'X' to close the dialog.
A summary of the devices on which the file was executed. Details include the file path and the number of times it was executed.
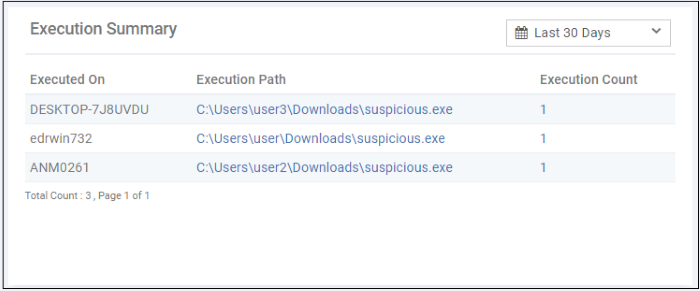
- Select the time-period for which the event trend should be shown. The period ranges from last 15 minutes to 30 days.
- View more records by clicking 'Next', 'Last', 'First', 'Previous' or any number.
- Executed On – The device on which the file was run.
- Execution Path – The location of the file on the device. Clicking the path link will open the 'Event Search' screen with the query pre-populated.
- Execution Count – The number of times the event has occurred.
Shows the details on which endpoint the file was downloaded (aka 'Entry Point'), the URL from where it was downloaded and the number of times it was downloaded.
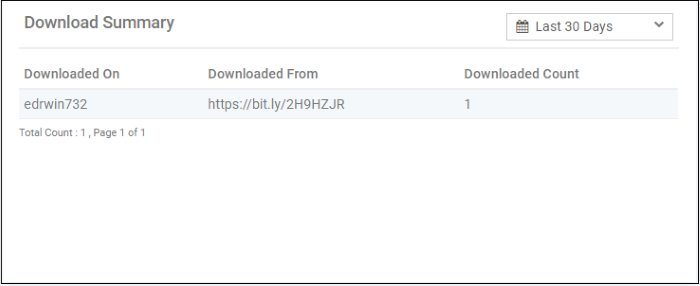
- Select the time-period for which the download summary should be shown. The period ranges from last 15 minutes to 30 days.
- View more records by clicking 'Next', 'Last', 'First', 'Previous' or any number.
- Downloaded On – The device on which the file was first downloaded
- Downloaded From – The location from which the file was downloaded
- Downloaded Count – The number of times the file was downloaded
Details of endpoints on which the file has created processes and the location of file from where it was run.
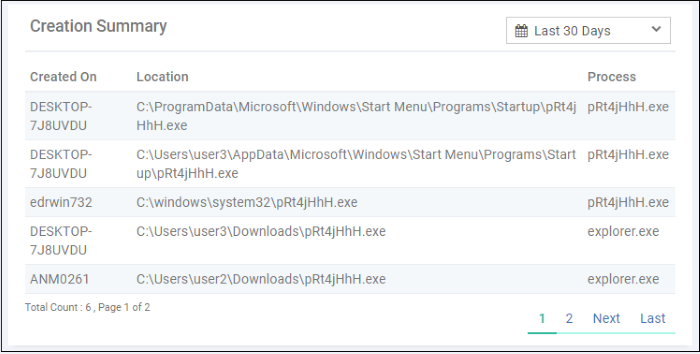
- Select the time-period for which the creation summary should be shown. The period ranges from last 15 minutes to 30 days.
- View more records by clicking 'Next', 'Last', 'First', 'Previous' or any number.
- Created On – The device on which the file was run
- Location – The path of the file from where it was run
- Process – The name of the application that was run
The number of times the file ran during the selected time-period.
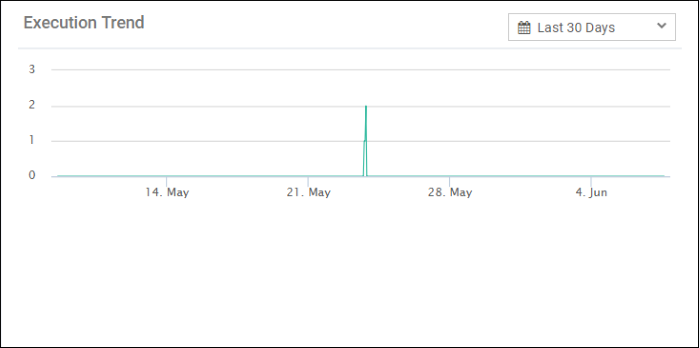
- Select the time-period for which the creation summary should be shown. The period ranges from last 15 minutes to 30 days.
- X-axis displays the selected date range and Y-axis provides the number of file execution counts.
- Place you mouse cursor on a particular point on the graph to see the number of executions.
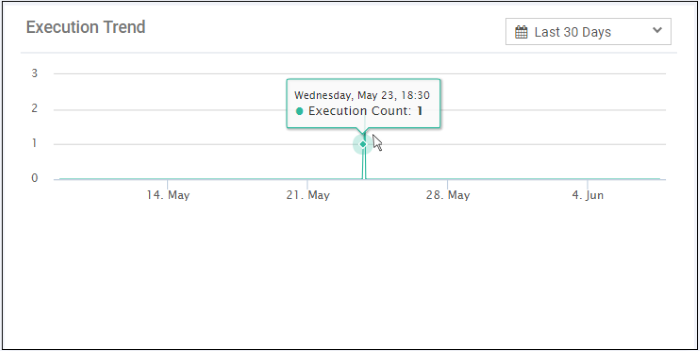
- You can zoom in by dragging any point on the graph. This lets you, for example, more clearly see the hours of the day when the file ran.
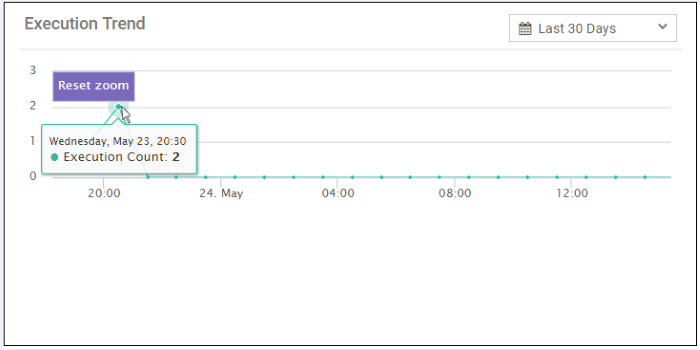
- Place your mouse cursor on a point in the line to see the number of counts.
- Click 'Reset Zoom' to view the original graph.


