Event Search
- The 'Event Search' interface lets you find specific events using built-in queries.
- cWatch ships with some useful sample queries, and you can construct your own queries.
- You have to create conditions for a search and configure the results table accordingly.
- You can also use the search results to construct another query.
- Click 'Investigation' on the left then 'Event Search' to open the interface:
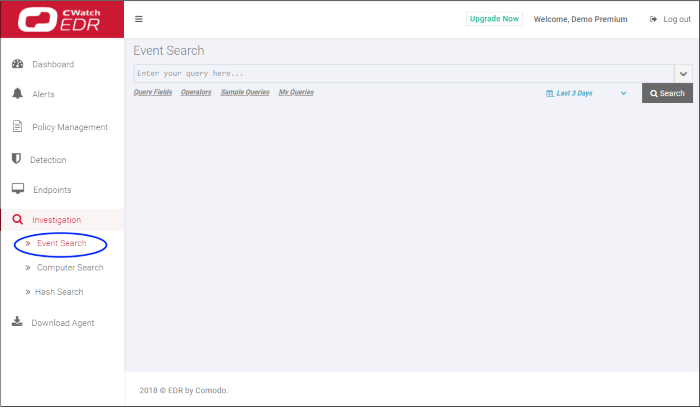
- By default, no custom queries are defined, allowing you search for all events that occurred during the last 3 days.
- Use the 'Query Fields' and 'Operator' links on the upper-left to build a custom event query.
- The first query field you add will automatically have the '=' operator appended to it (you can change this if required). You will need to enter the criteria after the operator.
- Any subsequent fields you add to the query will automatically be prefixed with the 'AND' operator.
- All queries that you save will be listed under 'My Queries'
- 'Sample Queries' are pre-defined, example queries. These can be used as standalones, or adapted to produce a more complex search.
- 'Select Fields' on the right lets you configure the columns of the results table.
- You can change the date range using the link 2nd from the right.
|
Event Search Interface - Table of controls |
|
|---|---|
|
|
Allows you to configure the 'Results' table for the query results displayed at the lower pane. |
|
|
Allows you choose the time period for which events are fetched. Periods range from 15 minutes to 1 month. You can also specify a custom period. |
|
|
Allows you to run a search operation based on the configured / general query. |
|
|
Allows you to add query fields for a custom query |
|
|
Allows you to add conditions for a custom query. |
|
|
Built-in sample event queries that are most often used. |
 |
Allows you to remove queries entered in the search field. |
 |
Allows you to save a custom query. |
 |
Saved custom queries will be listed here. |
The interface allows you to:
A general search returns all events recorded from all enrolled endpoints.
To run a general event search:
- Make sure the 'Search Box' field is blank.
- Use the time-range drop-down to pick a specific date or date range.
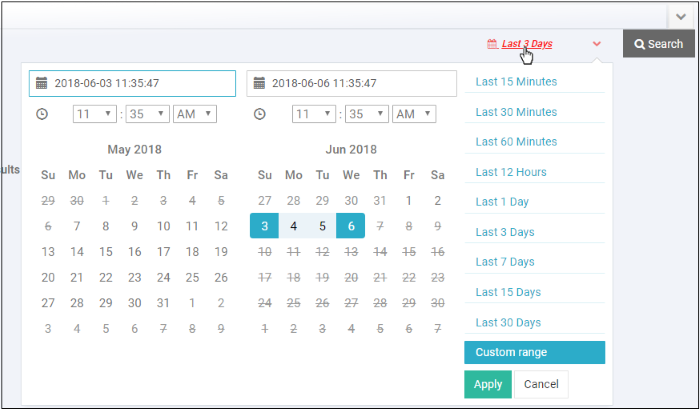
- Click 'Custom range' to choose specific dates:
- Click 'Apply', then 'Search'
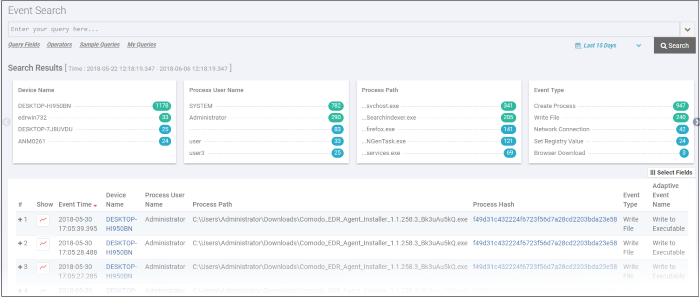
The results for the selected period will be displayed. See 'View Query Results' for more information.
Configure and run a custom query search
You can search for particular events by building custom queries. Custom queries can be configured in two ways:
To
configure a custom event query
- Click 'Query Fields' below the search box and select an event from the list.
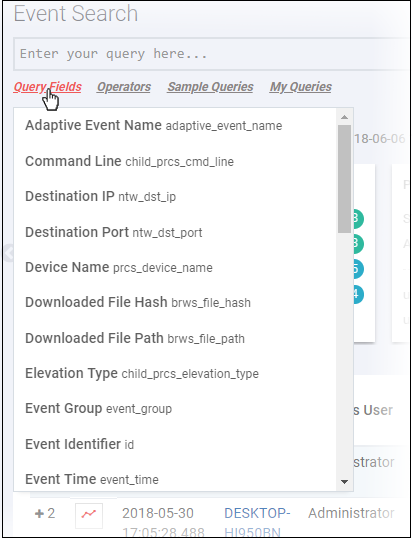
- Alternatively, click in the search box and use short cut keys 'Ctrl + space'. Select an event field from the list.
- Repeat the process to add more event fields for the query. The 'AND' operator will be automatically added to any subsequent fields you add.
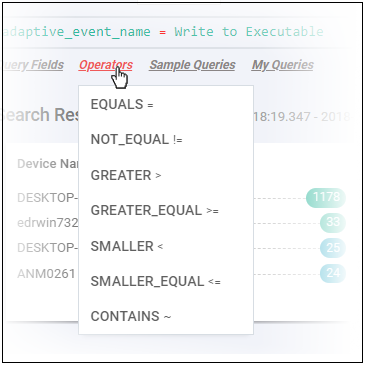
- Click 'Operators' link and select the operator from the drop-down. You can also enter the operator manually.
- Enter the relevant details of the event
fields.
The following example shows a search for 'Adaptive Event Name' = 'Run Untrusted Executable' AND 'Device Name' = 'DESKTOP-7J8UVDU':

- Next, select the time period for the custom query and click 'Search'
The search results for the custom query will be displayed:
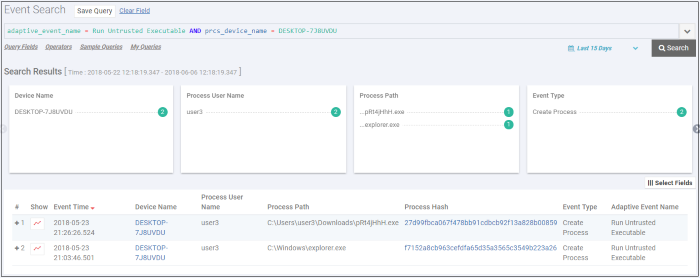
Please note the results for the
query will also display details for other fields also. See 'View
Query Results' for more information.
- Click 'Save Query' for future use. The saved query will be listed under 'My Queries'.
To configure a custom query using the search results
In addition to manually providing the event field details for creating a custom query, you can also query for a particular event from the search results.
The following example shows the general search results for a selected time-period.
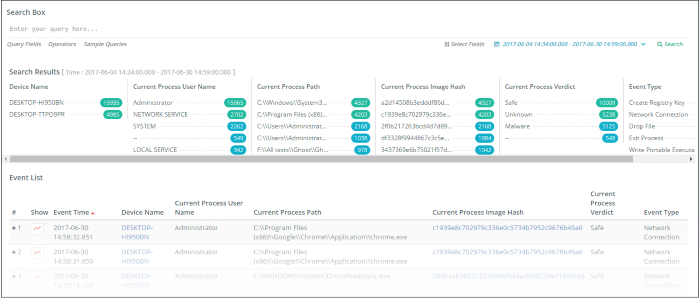
Summary Results section
The results summary section at the top shows results for all endpoints and events. You can select particular fields to build a custom query from the results.

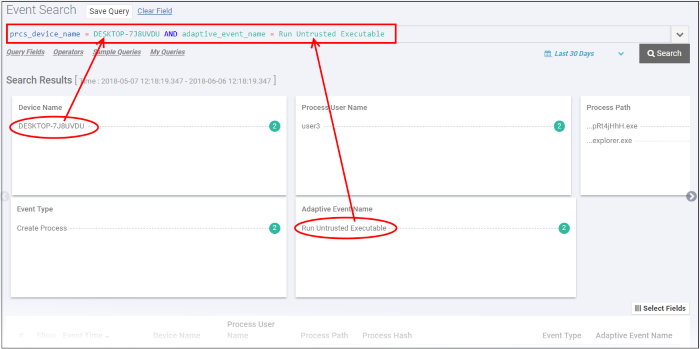
The result columns depend on the selected event fields. For example if you want to search for run untrusted executable events for an endpoint:
- First, click the endpoint under 'Device Name'.
The query will be automatically entered in the 'Search Box' and EDR
will provide all results for the endpoint.
- Click 'Run Untrusted Executable' under 'Adaptive Event Name'. The query will be automatically updated in the 'Search Box' and the results for the untrusted executable events on the endpoint will be displayed:
Event List section
The details shown in the summary results depend on the selected event fields. You can, of course, also choose fields from the 'Event List' section.
- Click the number beside a event list row from which you want to build a custom query

- Click the event field(s) details that you want to use to build a custom query.

The query fields will be automatically updated in the 'Search Box'.

- Select the time-period and click 'Search'
Events matching the custom query will be displayed. See 'View Query Results' for more information.
EDR ships with built-in sample queries that are often used for data analysis by administrators. This also serves as examples for administrators to create more complex queries.
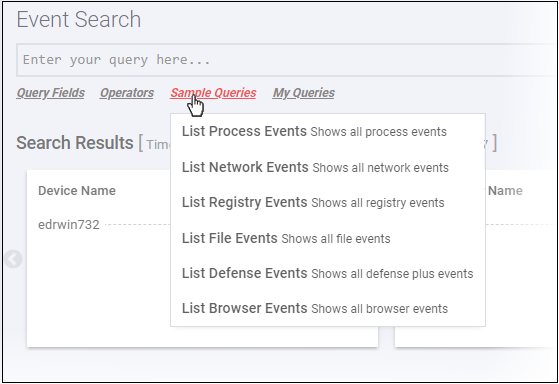
The sample query will be automatically updated in the 'Search Box'.

- Select the time-period and click 'Search'
Events matching the sample query will be displayed. See 'View Query Results' for more information.
Endpoint Detection and Response stores the generated events on
the cloud and these can be fetched anytime from anywhere using an
internet browser. Administrators can use these events for data
analysis and take remedial actions on endpoints.
The query results will be displayed depending on the type of query search. See 'Configure results table column headers for a query', 'Run a general event search', 'Configure and run a custom query search' and 'Use sample queries' for more details.
A summary of the search results is shown on separate tiles at the top. Results for each event are displayed below.
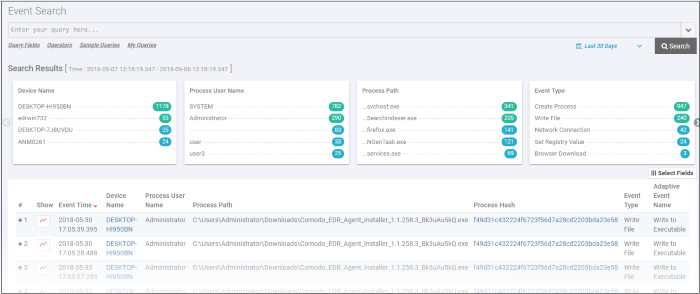
Summary Search Results

- The number beside each event detail indicates the total number of events recorded for that item.
- Clicking an event detail under an event field will display only the results pertaining to those items. This is similar to creating a custom query.
Event List
The lower section below the tiles displays the results for each event.
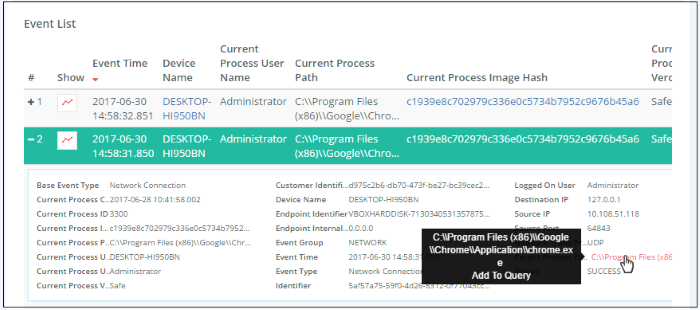
- Clicking an event will display all the event fields for that event type. The number of event fields displayed depends on the event type.
- Clicking an event detail beside an event field will display only the results pertaining to those items. This is similar to creating a custom query.
- Clicking
the
 icon in the 'Show' column for an event will display its
timeline. See 'Process
Timeline' for more details.
Configure results table column headers for a query
You can configure the results table to show columns which are important to your custom query. You can also view all the event fields pertaining to your search by clicking the '+' sign beside a query result.
- Click 'Select Fields' on the right to configure the result table columns:
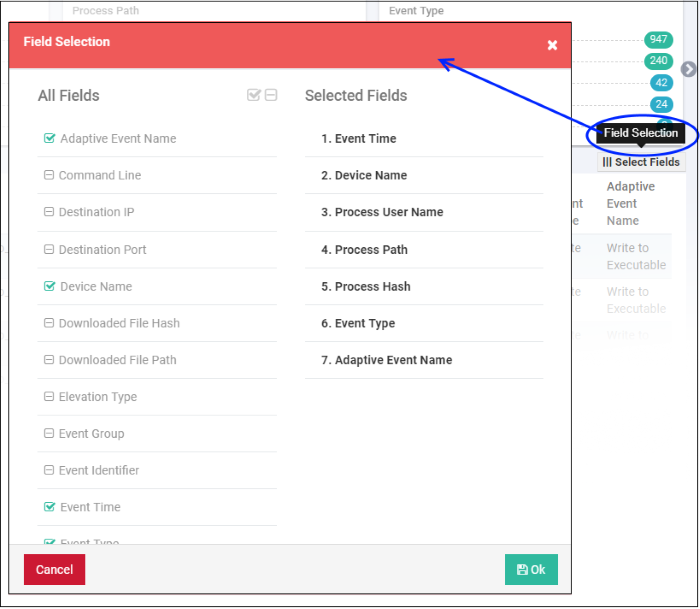
A check-mark is shown next to currently enabled fields. A 'field' in this sense is a column in the results table.
- Click the checkbox beside an individual field to enable or disable it.
- To display all fields,
click
 at the top
- To hide all fields,
click
 at the top
- All enabled fields are shown on the right, with field # 1 being the first column on the left. Click and drag a particular field to re-position it in the table
- Click 'OK' when done

Tip. You can still view all event fields for a result by clicking the number beside a event result row:

The number of event fields
displayed in the detailed results depends on the event type.


