The Dashboard
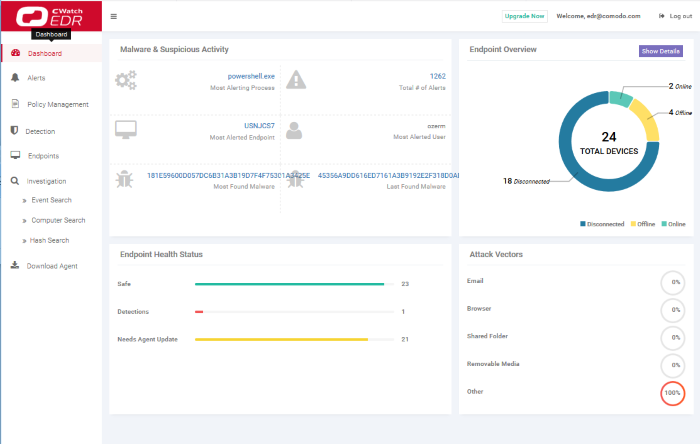
The dashboard is an at-a-glance summary of the security and connection status of enrolled endpoints. Each dashboard tile shows vital information about detected malware and allows you to drill-down further on areas of interest. Statistics include most the attacked endpoint, the quantity of malware found, the number of enrolled devices and so on.
- Click
'Dashboard' on the left to view the EDR dashboard

- Stand-alone and Comodo One / Comodo Dragon / ITarian enterprise customers – You can view endpoint statistics of your company.
- Comodo One / Comodo Dragon / ITarian MSP customers - You can view endpoint statistics of all companies managed by you. See MSP Dashboard to learn more.
Dashboard Tiles
- Malware & Suspicious Activity
- Most Alerting Process – Name of the application process that generated most alerts. Click the process name to open the 'Alerts' interface which shows more details. See 'Alerts' for more information.
- Most Alerted Endpoint – The name of the device for which the most number of alerts were generated. Click the name of the endpoint to open the 'Alerts' interface which shows more details. See 'Alerts' for more information.
- Most Found Malware - The hash value of the most prevalent malware on all your managed endpoints. Click the hash value to view malware details, including the endpoints that triggered the events, the date and time of the event and so on. See 'Hash Search' for more details.
- Total number of Alerts – The total number of alerts generated for all enrolled endpoints. Click the alert number to open the 'Alerts' interface. See 'Alerts' for more information.
- Most Alerted User – The device user for whom the most alerts were generated.
- Last Found Malware - The hash value of the malware that was detected most recently. Click the hash value to view malware details, including the endpoints that triggered the events, the date and time of the event and so on. See 'Hash Search' for more details.
- Endpoint Overview
- Total Devices – The total number of endpoints you have added to EDR
- Online Devices - The number of devices that are currently active.
- Offline Devices - The number of endpoints that are currently shut down and not connected to EDR.
- Disconnected Devices - Enrolled devices that are logged off. Disconnected devices includes endpoints that were not shut down properly or crashed.
- Click 'Show Details' to open the 'Endpoints' interface to view information about the endpoint. See 'View Enrolled Endpoints' for more details.
- Endpoint Health Status
- Safe – The number of endpoints where no malicious activities were detected.
- Detections – The number of devices on which malicious and suspicious activities were detected.
- Needs Agent Update – The number of endpoints which are using an outdated version of the EDR agent. Endpoint Detection and Response supports auto-update. Whenever an endpoint with outdated agent version goes online, it gets the latest update.
- Attack
Vectors – The
channel via which malicious activities originated on the endpoints.


