MSP Dashboard
Comodo One / Comodo Dragon and ITarian MSP customers can view endpoint statistics of all companies managed by them.
- Login to your Comodo One / Comodo Dragon / ITarian account
- Click 'Applications' > 'cWatch EDR'
- Click 'Store' if you haven't yet activated EDR. You can install the free version from the 'CWatch EDR' tile.
- Click
'MSP Dashboard' on the left of the Endpoint Detection and Response interface to view statistics of all companies on your account.
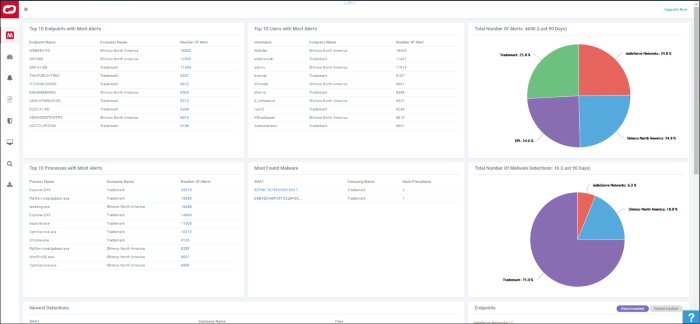
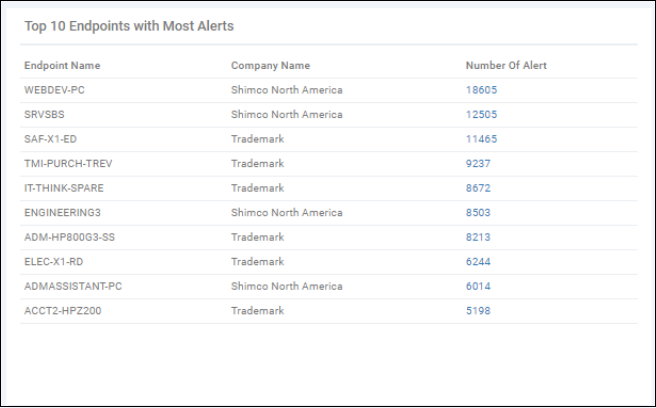
Top 10 Endpoints with Most Alerts - List of endpoints which caused the most alerts to be generated (all time).
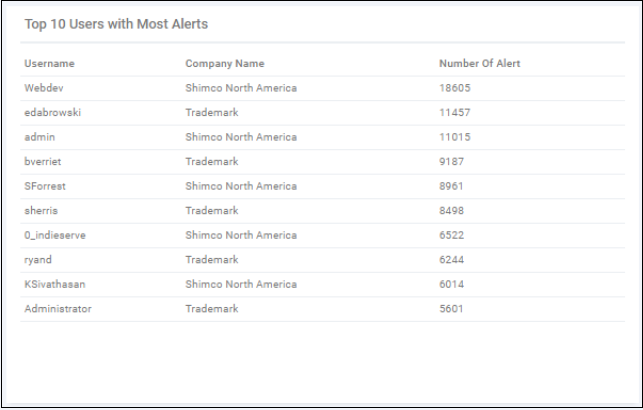
Top 10 Users with Most Alerts- List of users who caused the most alerts to be generated (all time).
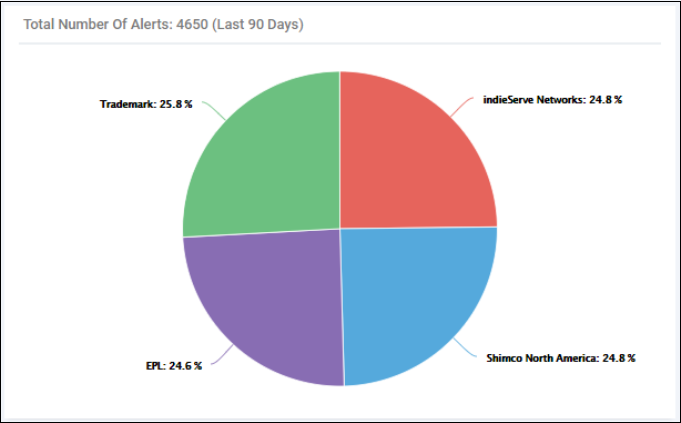
Total Number of Alerts (Last 90 Days) -Amount of alerts generated by all users and all endpoints in the previous 90 days. Alerts are broken down by company responsible:
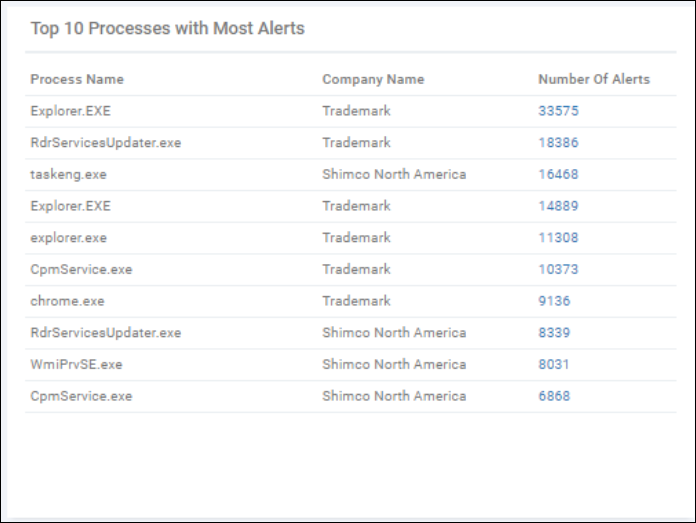
Top 10 Processes with Most Alerts - The 10 processes and applications that triggered the most alerts (all time).
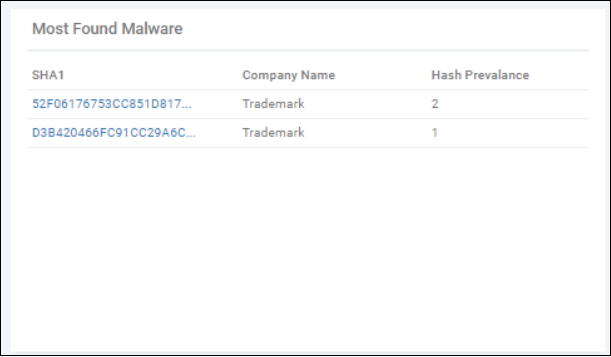
Most Found Malware - The most prevalent malware on your protected endpoints (all time).
- SHA1 = hash of the malware.
- Hash prevalence = how many instances of the hash were found on endpoints which belong to the company shown in the middle column.
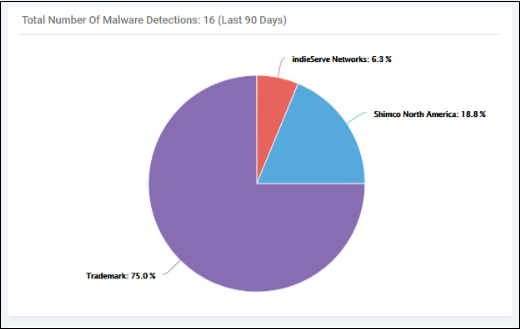
Total Number of Malware Detections:(Last 90 Days) - Quantity of malware found on your protected endpoints in the previous 90 days. Malware is broken down by company affected:
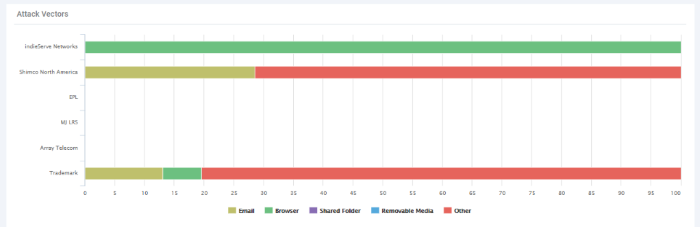
Attack Vendors
Shows the methods by which threats were launched on your companies. Each bar shows the % of each type in relation to all threats.
Y axis - Company affected by the threat
X axis - Percentage of total threats
Legend - Method used to deliver the threat. Examples include 'Email', 'Browser' and 'Shared Folder'.