The Admin Console
- The EDR admin console allows you to enroll endpoints, create polices, view and analyze events and more.
- You need to install the EDR agent on all endpoints you wish to manage. Click 'Download Agent' to get started.

The buttons at the top of the interface allow you to:
|
|
Expand / collapse the left-hand menu. |
|
|
Allows you to purchase a higher subscription plan. The available plans are:
|
|
|
Log out of the EDR admin console. |
The menu on the left contains links to the main areas of the console:
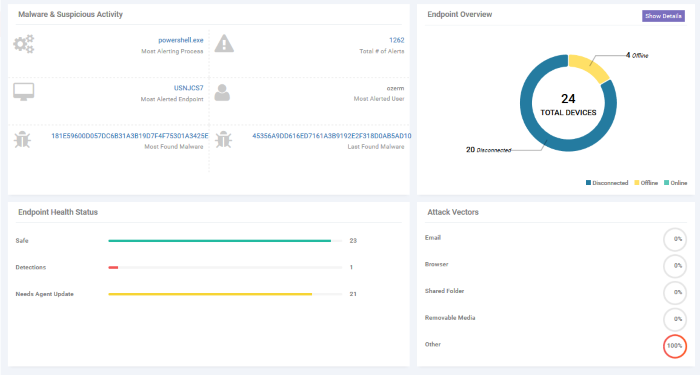
- Dashboard - A top level overview of events on your managed endpoints. The dashboard shows the number of online, offline and disconnected devices, a summary of detected malware and the most attacked/ most recently attacked endpoints. See 'The Dashboard' for more details.
- Alerts – A list of warnings generated by a policy breach. Alert details include name of the event, time of the breach and more. See 'Alerts' for more details.
-
Policy Management – Endpoint Detection and Response ships with default policy ships with default policy that will monitor and generate alerts for numerous attack types and activities. You can also configure custom policies according to your requirements. See Manage EDR Policies for more details.
- Endpoints - A list of Windows devices enrolled to EDR. Each row shows various details about the endpoint, including computer name, operating system, connection status and more. See 'View Enrolled Endpoints' for more details.
- Detection - Displays more detailed information about the malware found on your endpoints. See 'View Event Details on Endpoints' for more details.
- Investigation – Allows you to search for, identify and analyze events by event type, by computer or by hash value. See 'Investigation' for more details.
- Download
Agent - Download the endpoint agent. You
need to install this agent on your target Windows machines in order
for EDR to monitor them. See 'Adding
Endpoints to EDR' for more details.


