


Computer Search
The 'Computer Search' screen shows events recorded on all endpoints added to EDR. Details include event trends, network connection events, malware detection events and so on.
- Click 'Investigation' on the left then 'Computer Search' to open the interface
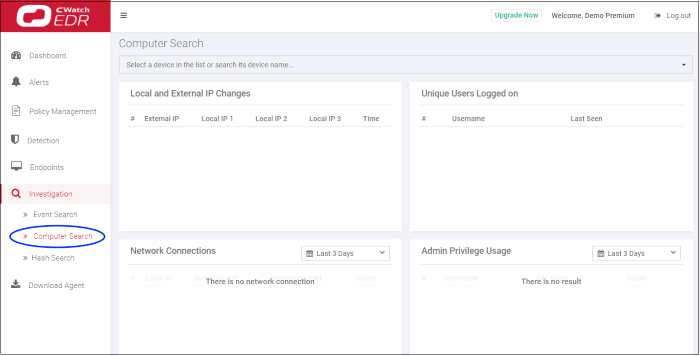
- By default, the screen will be blank with
search time range pre-selected for the last 3 days.
- Please note the search field will be auto-populated and results displayed for the endpoint that is clicked from the dashboard.
Search and Sorting options
- Search option – The 'Search' box above the table allows you to filter the list.
- Click anywhere on the row and select from the device list
OR
- Click anywhere on the row and enter full or partial endpoint name in the search box and select from the suggestion
Use the time-range drop-down to show event information for a specific date or date range (applies to Network Connections, Admin Privilege Usage, Malware Detections and Event Trend tiles).
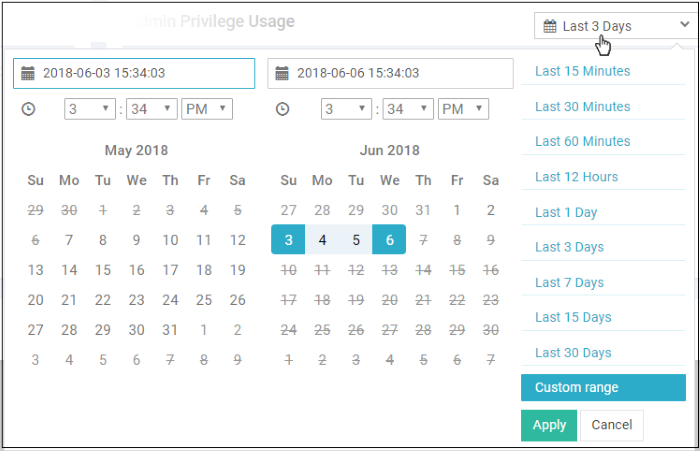
- Click 'Custom range' to choose specific dates:
- Click 'Apply'. The results for the selected
period will be displayed.
Information
about the selected endpoint is shown below the search box:
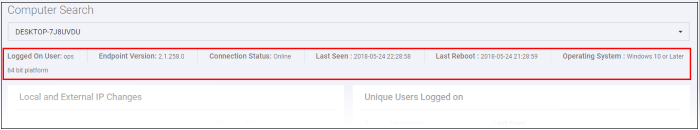
- Logged On User – Endpoint username at the time of event logging
- Endpoint Version - Software version of the EDR agent
- Connection Status – Indicates whether the endpoint is connected to EDR
- Connection Status – Indicates whether the endpoint is connected to EDR. The statuses are:
- Online – Indicates the endpoint is normally sending message to the EDR server
- Offline – Indicates that the agent sent last message to the server along with the information that it would of offline
-
Disconnected – Indicates the agent was not able to send the message that it would go offline.
- Last Seen - Indicates the latest date and time the EDR agent on the endpoint updated EDR
- Last Reboot - Date and time the endpoint was rebooted last
- Operating System - The details of endpoint's OS.
This tile lists any changes in the endpoint's local IP and external IP.
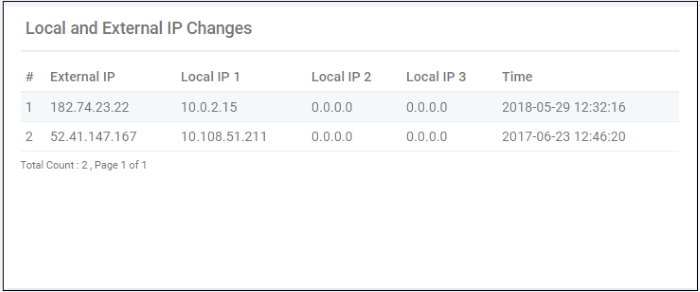
- External IP – The current external IP through which the endpoint connects to other external networks.
- Local IP 1 – The current local IP of the endpoint.
- Local IP 2 and 3 – Details of the previous local IPs (for example, the endpoint is moved from one network to another and allotted different IPs)
- Time - The date and time of last recorded change.
This tile displays the number of events that were recorded from the endpoint for the selected time-period.
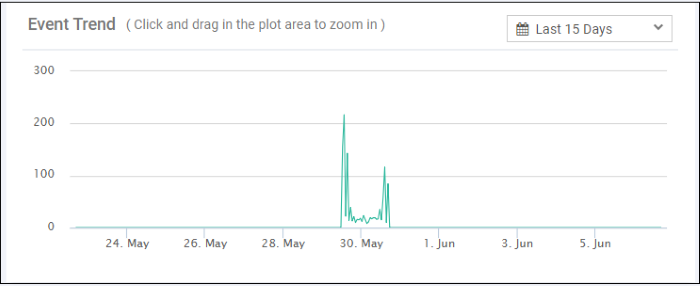
- Select the time-period for which the event trend should be shown. The period ranges from last 15 minutes to 30 days.
- The X-axis displays the selected date range and Y-axis provides the number of events.
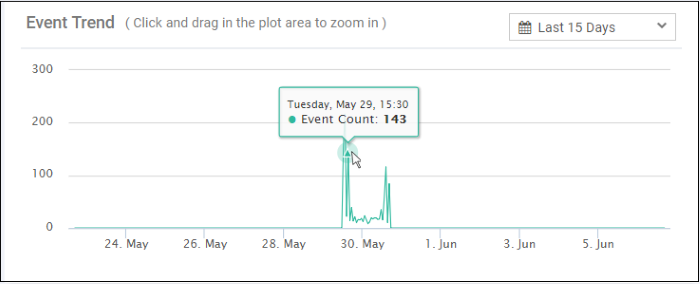
- Placing the mouse cursor on a particular point on the graph displays the number of events.
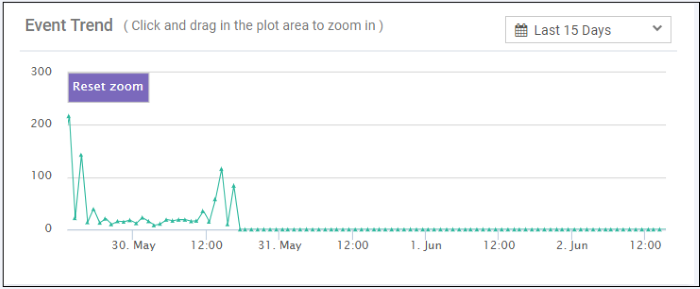
- To view the number of events for a particular of time, click on the graph and drag to zoom. You can view the number of recorded events by hourly basis. Zoom in again if required.
- Place your mouse cursor on a point in the line to see events for a specific day.
- Click 'Reset Zoom' to view the original graph.
Displays the most recent login times of every user that has logged onto the endpoint.
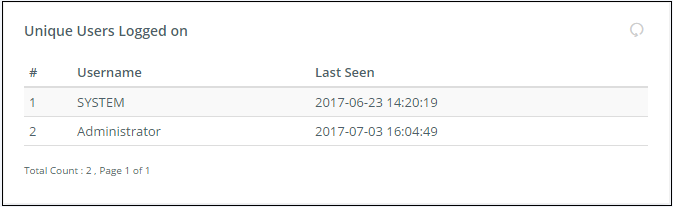
- Username – The name of the user that is
currently logged in and last communicated time to EDR. SYSTEM
indicates the date and time the endpoint was first connected to EDR.
- Last Seen – Date and time the endpoint
communicated to EDR.
Displays details of events that required admin privileges.
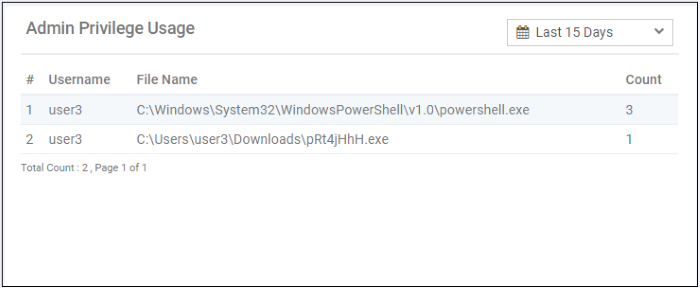
- Select the time-period for which the data should be shown. The period ranges from last 15 minutes to 30 days. You can configure custom range also.
- Username – The name of the user that used the admin level privileges on the endpoint.
- File Name – The name of the application that was used.
- Count – The number of times the event was recorded. Clicking the number will display the event details in the 'Event Search' interface.
Displays the details of network connection events for the selected time-period.
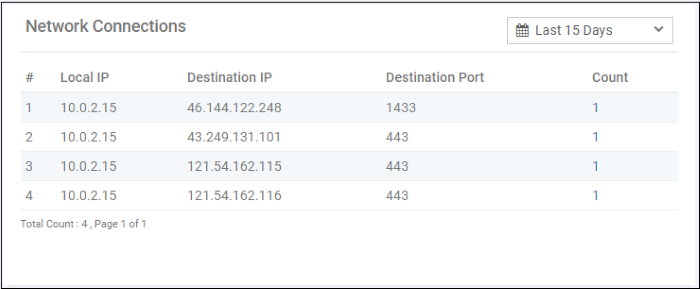
- Select the time-period for which the data should be shown. The period ranges from last 15 minutes to 30 days. You can configure custom range also.
- Local IP – The internal IP address of the endpoint.
- Destination IP – The destination IP details to which the connection was established.
- Destination Port – The destination port to which the connection was established.
- Count – The number of time the connection to the destination IP and port was established from the endpoint. Clicking the number will provide the event details in the 'Event Search' interface.
- View more records by clicking 'Next', 'Last', 'First', 'Previous' or any number.
Displays the malware detected events on the endpoint for the selected period.
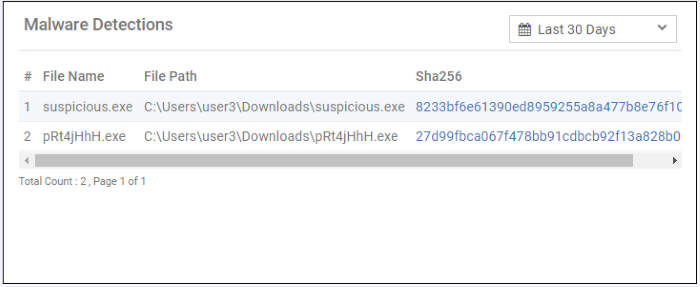
- Select the time-period for which the data should be shown. The period ranges from last 15 minutes to 30 days. You can configure custom range also.
- File Name – The name of the file that was detected as malware by EDR.
- File Path – The location of the malware file.
- Sha256 – The hash signature of the malware file. Clicking a hash signature will provide the full details in the 'Hash Search' interface.
- View more records by clicking 'Next', 'Last', 'First', 'Previous' or any number.