View cWatch Office Reports
- Tap the 'Reports' icon on the launch bar to open this section.
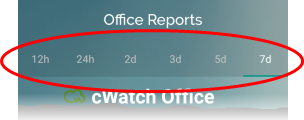
- The options at the top allows you to choose the time period of statistics:
- The 'Device Name' drop-down lets you to choose the device/network whose statistics you want to see:
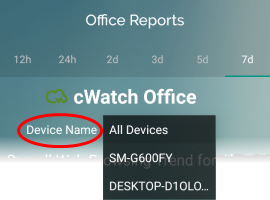
- Choose 'All Devices' to view overall statistics for all devices in your network
- Select a device name if you want to view stats for a specific device
The total websites blocked, total websites visited and total attacks blocked will be displayed at the top of the page for the selected item:
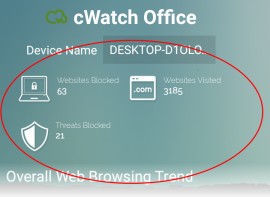
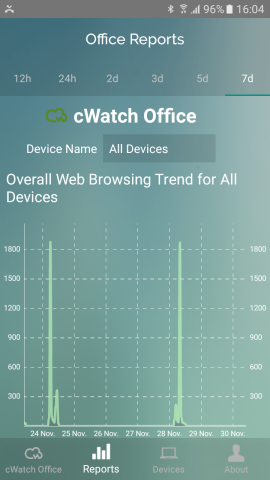
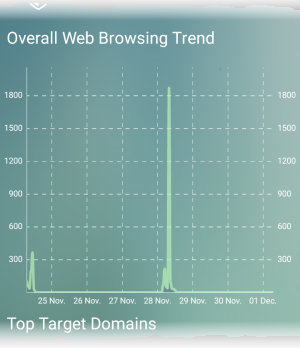
The following charts are displayed for the chosen device.
- The chart shows the number of websites visited by the device during the selected time-period.
- The X-axis shows the time period and the Y-axis shows the number of websites visited
- An
example is shown below:
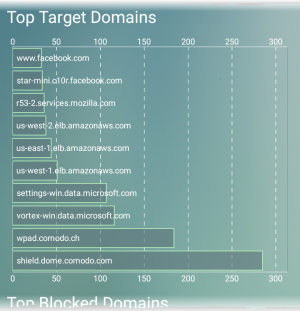
- Shows the ten websites visited most often by the device within the selected period.
- The number of visits to each website is shown in the X-axis.
- An
example is shown below:
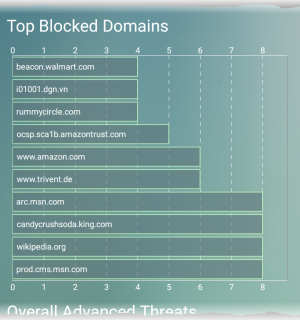
- Shows the top-ten websites blocked on the device within the selected period.
- The number of access attempts to each website is shown in the X-axis.
- An
example is shown below:
- Shows the top-ten types of attacks blocked on the device within the selected period.
- The number of times each attack was blocked is shown in the X-axis.
|
Tip: You can view the types of attacks that cWatch blocks in the 'Default Protection Settings' page of the web console. See 'Attack Categories and Threats' in View Default Protection Settings for more details. |
- An example is shown below:
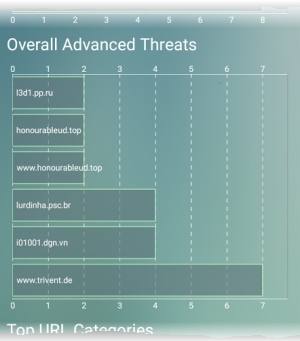
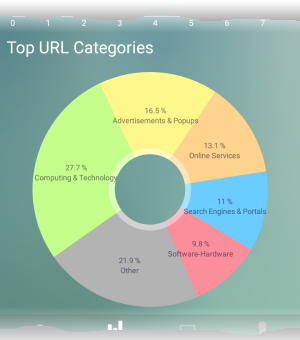
- Shows the ten website categories which were most often visited on the device.
- An
example is shown below:
