


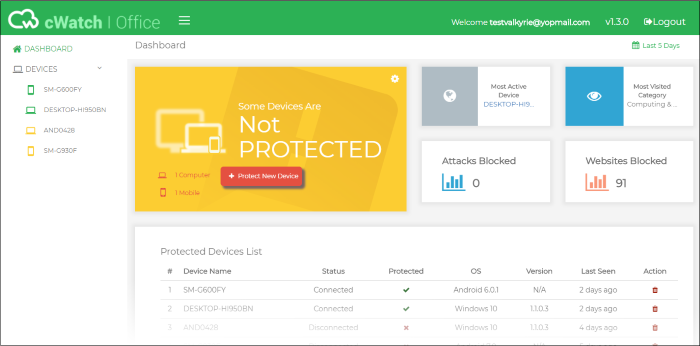
The cWatch Office Dashboard
The dashboard shows top-level data on the networks and devices protected by cWatch Office. Statistics include websites and attacks blocked, recent events, live surfing monitor and more. This allows you to quickly identify harmful websites visited by users and effectively track the risks associated with each device.
- Click 'Dashboard' on the left to open the dashboard.
- Use the date range picker at top-right to choose the time period of the statistics:
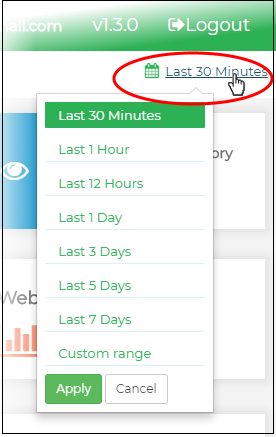
- Statistics are shown for the last 30 minutes by default
- You can change this by clicking the link at top-right and choosing a different range
- Click 'Custom range' to choose a specific date range
- Click
'Apply' to view statistics for the selected range
The overall protection tile shows how many enrolled devices are connected to cWatch protection. It also allows you add new networks/devices and view default protection settings.

- The color of the tile indicates the overall protection status:
- Green – All enrolled devices are connected and protected
- Yellow – Some devices are offline or not connected to the cWatch
- The number of unprotected devices is shown at the bottom-left:

- Click 'Protect New Device' to enroll new devices or networks to cWatch Office protection. See Add
Networks and Devices if you need more help with this.
- Click the gear icon at the top-right to
 view the default protection settings applied to devices after enrollment. See View
Default Protection Settings for more details.
view the default protection settings applied to devices after enrollment. See View
Default Protection Settings for more details.
|
The device which has visited the most web pages within the selected time period. This includes to both allowed and blocked websites. Click the device name to view dashboard statistics for the device. See The Device Overview for more details. |
 |
 |
The website category visited most often by devices in your cWatch network. |
|
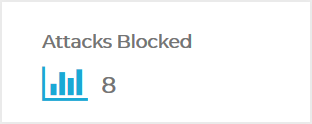
The total number of attacks blocked on all enrolled devices/networks within the selected period. Tip: The 'Default Protection Settings' page lets you view the types of attacks that cWatch blocks. See 'Attack Categories and Threats' in View Default Protection Settings for more details. |
 |
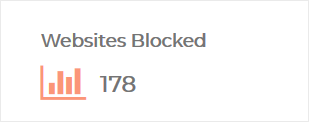 |
The total number of website access attempts that were intercepted and blocked on all devices. The number of sites blocked
depends on the protection settings active on your devices/networks. |
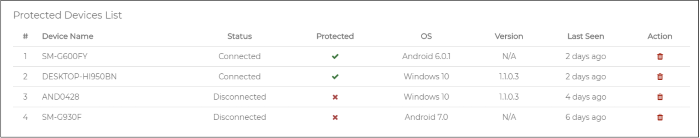
Shows all devices that have been enrolled for cWatch Office protection.
|
Protected Devices List - Column Descriptions |
|
|---|---|
|
Column Header |
Description |
|
Device Name |
The label of the enrolled device. |
|
Status |
Whether or not the device is currently connected to cWatch Office. A device must first be connected for it to become protected. |
|
Protected |
Whether or not the device is currently protected by cWatch Office. |
|
OS |
The operating system version of the device. |
| Version | The version number of the cWatch Office agent. This applies to Windows devices only. |
|
Last seen |
The most recent web browsing activity recorded for the device. |
|
Action |
Remove the device from cWatch Office.
|
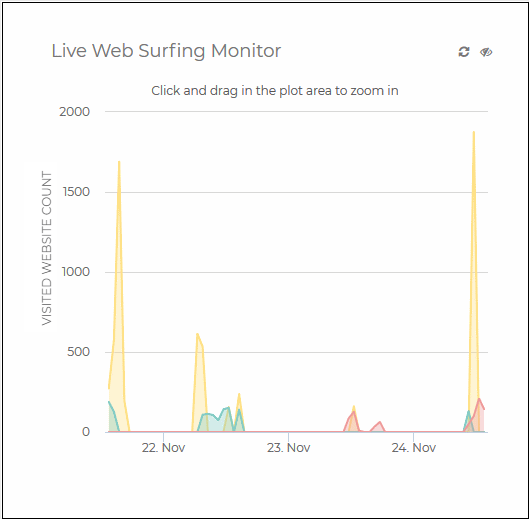
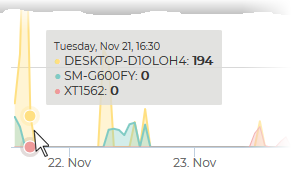
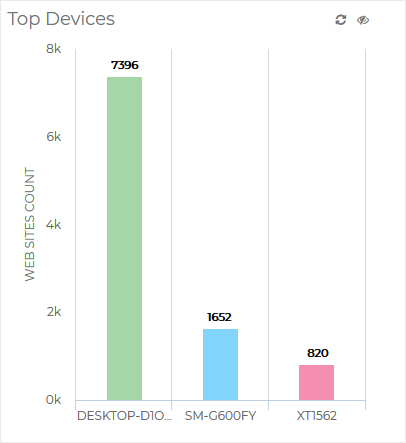
Shows the number of websites visited by each enrolled device during the selected time-period.
|
 |
|
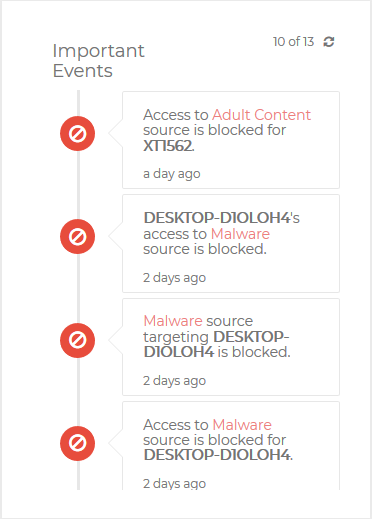
A timeline of noteworthy security events across all devices/networks in the selected time period. Events can include blocked websites and potential attacks which were prevented by cWatch.
Tip: The 'Default Protection Settings' page lets you view the types of attacks that cWatch blocks. See 'Attack Categories and Threats' in View Default Protection Settings for more details. |
 |
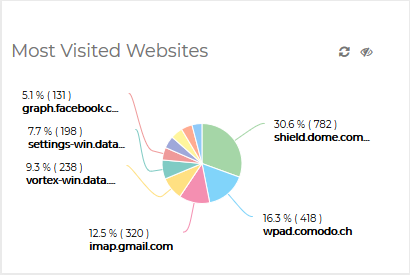 |
The ten websites visited most often by all devices in your cWatch network.
|
|
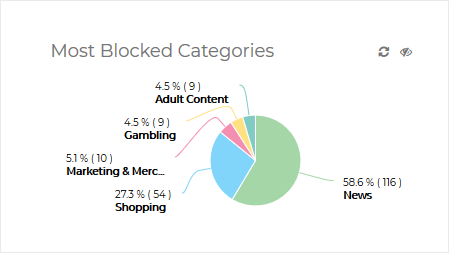
The ten website categories which were most often visited and blocked in your cWatch network. The categories blocked depends on the protection settings active on your devices/networks. See Manage Protection Settings for a Network/Device for more details on protection settings.
|
 |
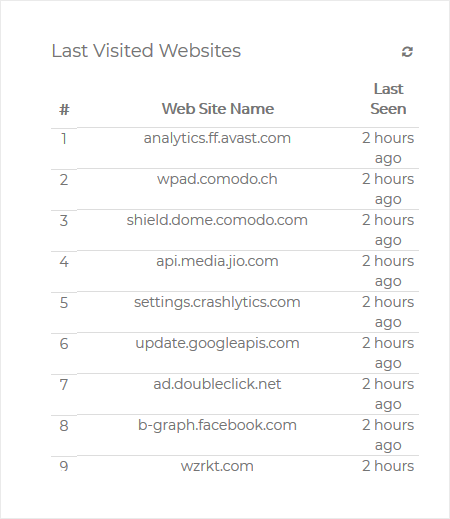 |
The 100 websites most recently visited by devices in your cWatch network.
|
|
The ten devices which made the most website requests within the selected time-period.
|
 |