My Analysis Statistics
The 'My Analysis Statistics' page displays how many files have been submitted for your account.
To view your Verdict account statistics:
- Click
the hamburger menu button top-left
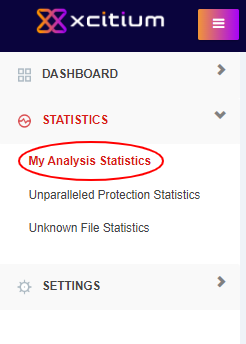
- Click 'Dashboard'> 'My Analysis Statistics' link on the user menu

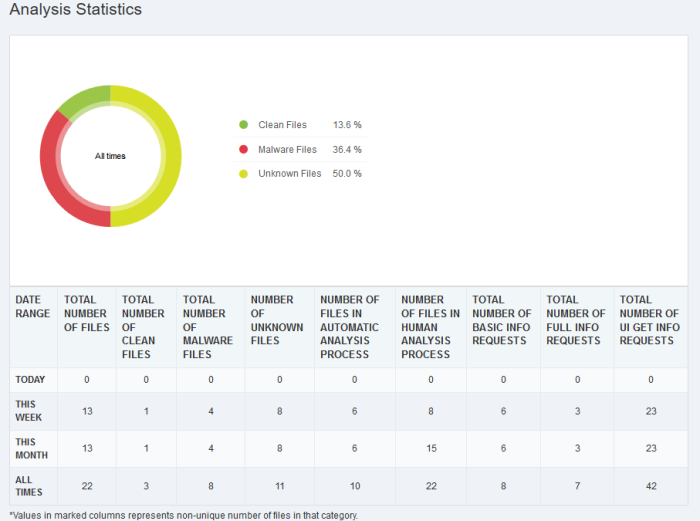
The 'My Analysis Statistics' page will open:

It shows the following details:
- Today - Details of files submitted today
- This Week - Details of files submitted this week
- This Month - Details of files submitted this month
- All
Times - Total number of files submitted since account creation
|
Analysis Statistics - Table of Column Descriptions |
|
|---|---|
|
Column Header |
Description |
|
Date Range |
Indicates the period of usage. |
|
Total Number of Files |
Total number of files submitted for the period. |
|
Total Number of Clean Files |
Total number of files found to be clean. |
|
Total Number of Malware Files |
Total number of files found to be malware files submitted. |
|
Number of Unknown Files |
Indicates the number of files that cannot be classified as definitely safe or definitely malware after analysis. |
|
Number of Files in Automatic Analysis Process |
Number of files submitted for automatic analysis. |
|
Number of Files in Human Expert Analysis Process |
Number of files submitted for human expert analysis. |
|
Total Number of Basic Info Requests |
The number of times the user has used the Verdict REST API (fvs_basic_info) to request basic analysis results from the Verdict database. Basic information includes whether the file has been previously uploaded, the verdict of the last analysis, the last and first analysis dates, and whether or not the file is white-listed. |
|
Total Number of Full Info Requests. |
This is similar to a basic info request (above) but shows greater detail.It shows the number of times the user has used the REST API (fvs_full_info) to request results from Verdict. The greater detail includes static, dynamic and human expert results, including behavioral and file information. |
|
Total Number of UI Get Info Requests. |
The number of times the user has requested analysis results via the dashboard. This can be done by clicking
the 'View File Info' |
- The values in parentheses represent the unique number of files for which information was requested. For example, '15 (5)' means you made 15 total requests spread across 5 different files.


 button or by searching the SHA1 hash of a file.