View and Manage the Home Console
After logging in to Customer Relationship Management (CRM), the home page will be displayed by default. The statistics and charts shown on the home page can be customized by adding different widgets.
Widgets are tiles containing key performance indicators which you can add to the home screen.
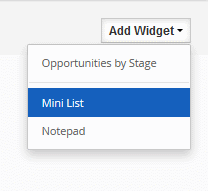
- To add a widget, go to the home page and click the 'Add Widget' button.
- Choose a widget from the list. The chosen tile will appear on the home screen.
- To refresh a widget, click the 'Refresh' icon at the top-right of the widget tile
- To remove the widget, click 'X' at the top-right of the tile
- Click the cog icon at the top-right of a widget tile to filter the data which is shown.
The following sections provide more details about each of the various tiles you can add:
- History – A real-time feed of user actions performed on records in modules. The 'History' widget cannot be deleted.

Administrators can see a complete history of changes across all records. Non-admin users can only see their own changes in the history.
- Use the 'History' search filter to view records per 'Comment' or 'Updates',
You can search upcoming activities as per 'Mine' or 'All' records.
- Funnel – Shows the number of opportunities you have in each stage of your sales cycle.
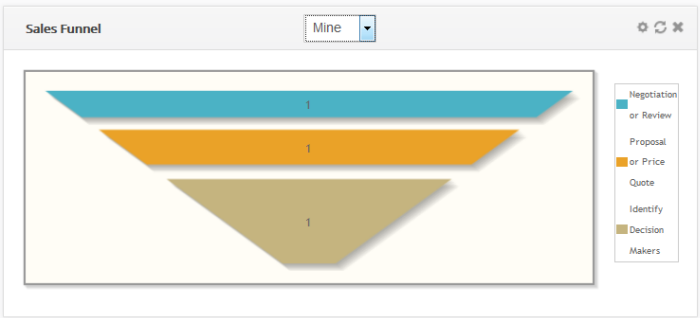
Use the drop-down above the chart to view the sales funnels of individual users, groups or of the entire company.
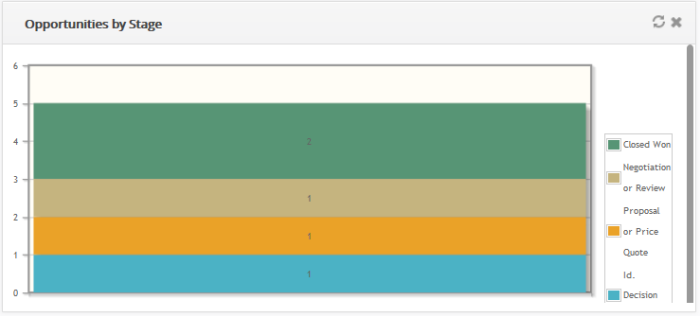
- Opportunities
by Stage – Shows a
bar chart representation of the Opportunity records of different
users according to sales stages
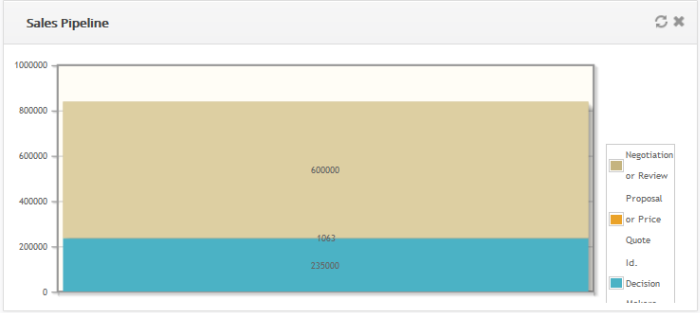
- Sales Pipeline – Shows the amount of potential revenue tied up in each stage of your sales cycle.
- Revenue by Salesperson – Shows revenues generated by different sales representatives on your team
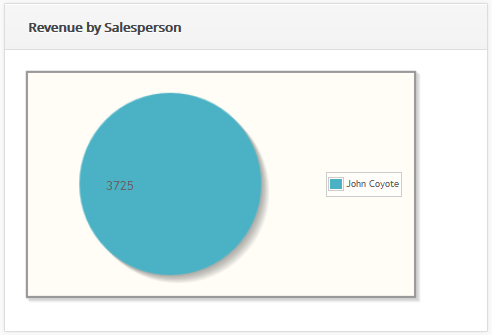
You can search for revenue by specific salespersons by clicking the cog icon at the top of the widget.
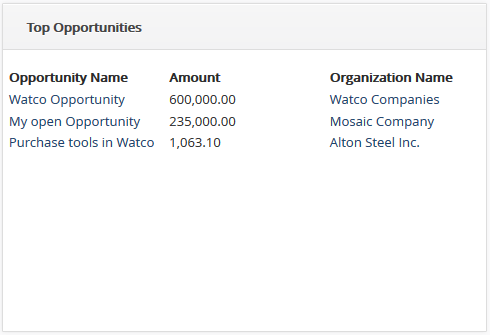
- Top Opportunities - Shows open leads with the highest projected revenues
- Leads by Status - Shows the status of open leads and how many are in each status.
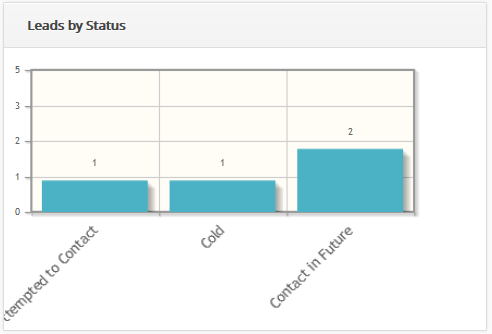
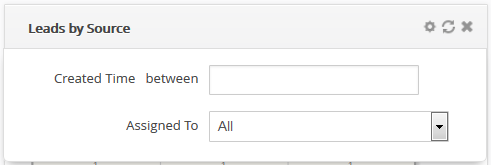
Click the cog icon to filter leads by creation date and/or by salesperson.

- Leads by Source - Shows the channels through which your leads were generated. The number of leads created by a particular channel is shown above its bar
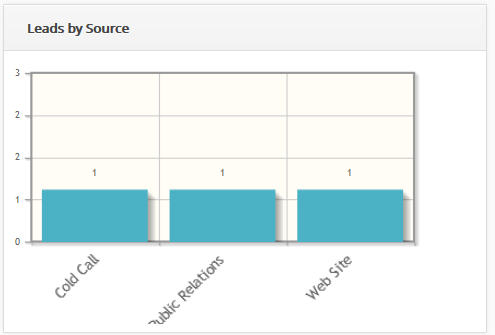
Click the cog icon to filter leads by creation date and/or by salesperson.
- Leads by Industry - Shows leads by the industry vertical to which they belong.
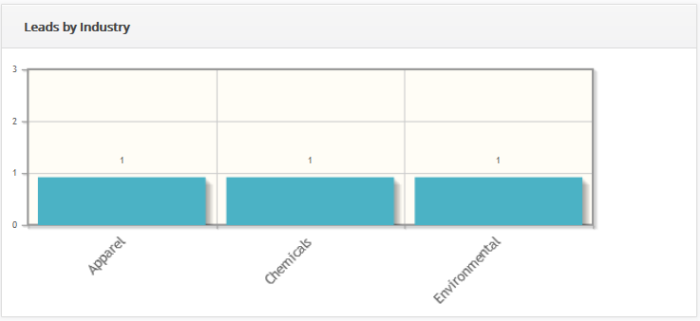
Click the cog icon to filter leads by creation date and/or by salesperson.

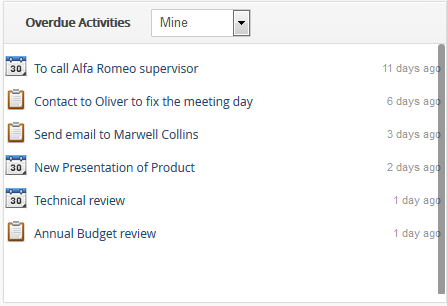
- Overdue
Activities - A list of events which were not completed by the deadline set for the task.
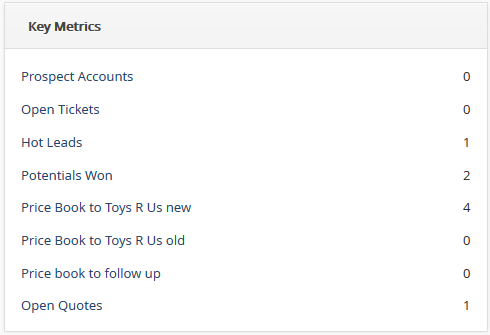
- Key
Metrics - A top-level list of important statistics about your sales operations.
- Tag
Cloud – The list of all tagged records. You can tag a record from any of the CRM interfaces and it will be displayed in the 'Tag cloud' tile in the home page.

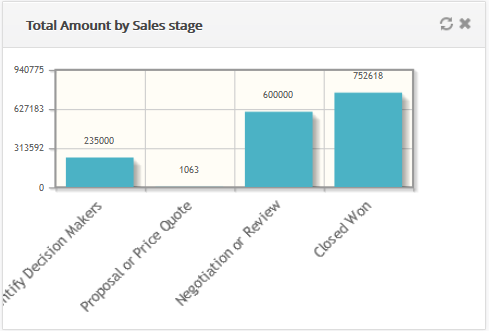
- Total
Amount by Sales stage - Shows a bar chart of opportunities according to their sales stages.
- Mini
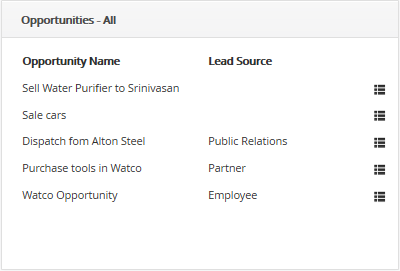
List – Allows you to display summary data from CRM modules.
- To add a mini list, click 'Add Widget' button and then click 'Mini List' from the drop down menu.
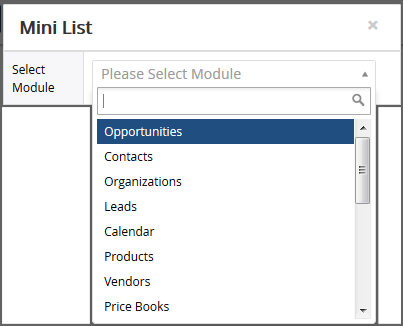
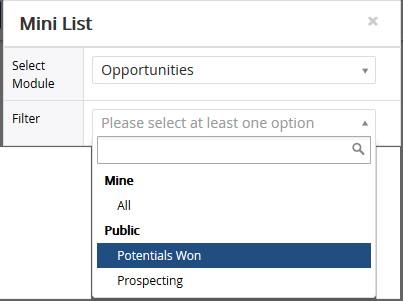
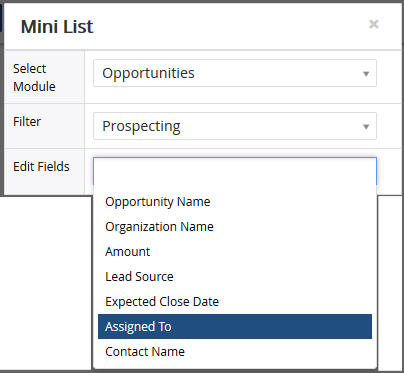
- In the pop-up, select a desired Module, Filter, and select fields (Max 2) that you want to see records from
- Click
'Save' to apply the filter

- Notepad - Allows you to write and save quick notes on the home page.

- Enter notepad name and notepad content details and then click 'Save'.
The note will be displayed on the home interface.

- To edit the note, click the 'Edit' button at the top right corner.
Each module has a dashboard area accessible from the left side of the module interface.
The
'Quick Create' menu on the right ('+' icon) allows you to quickly add
new 'Campaigns', 'Organizations', 'Products', 'Vendors',
'Leads', 'Opportunities', 'Services', 'Events', 'Contacts', 'Assets'
and 'Price Book'. See Quick
Create to create these records in short period.


