Generate a Report
By default, all reports are stored in the 'All Reports' folder. You can also create custom report folders as required.
- Click 'All' > 'Reports'
- Click the 'Add Report' drop-down button. There are two available report options:
- Details Report - Provides a customized view of client based activities
- Charts - Allows you to create a custom chart

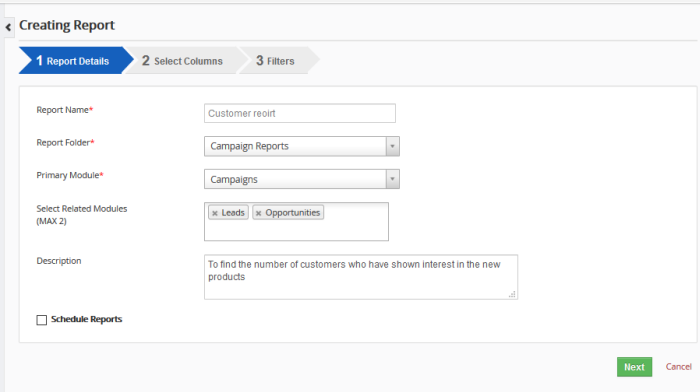
- Click 'Detail Report' to open the first step of the report creation wizard:

- Report Name - Please choose a name which accurately describes your report.
- Report Folder - Select the folder in which to save your report. Ideally, the folder name will contain the name of the primary module for identification purposes. You can create a new folder by clicking the '+ Folder' button.
- Primary Module - Should be the module from which the bulk of your report data is drawn. You can choose how much or how little is included from the module in step 2, 'Columns'.
- Select
Related Modules - Adding related modules
lets you include data from those modules in your report. Again, you
can choose which specific data is included in step 2, 'Columns'.
- 'Schedule Reports' – Order your report to be automatically generated at regular intervals. You can have reports sent to specific contacts or email addresses.

-
Click 'Next' to continue to step 2.
- The second step lets you choose which data is shown in your report from your primary and related modules.
- You choose the data by adding up to 25 columns (data items) from your modules.
- You can also group your data by column name and choose how numerical data is calculated.

- Select columns (Max 25) - Select up to 25 data pieces to include in your report. Click in the field to begin adding columns.
- Group By - Sort data in ascending/descending order of a particular column.
- Calculations – Choose which calculations are shown for numerical data in your report. You can pick 'Sum'. 'Average', 'Lowest Value', 'Highest Value', or all types. The 'Calculations' section will only be available if the modules in your report contain numerical data.
- Click 'Next' to continue to step 3.
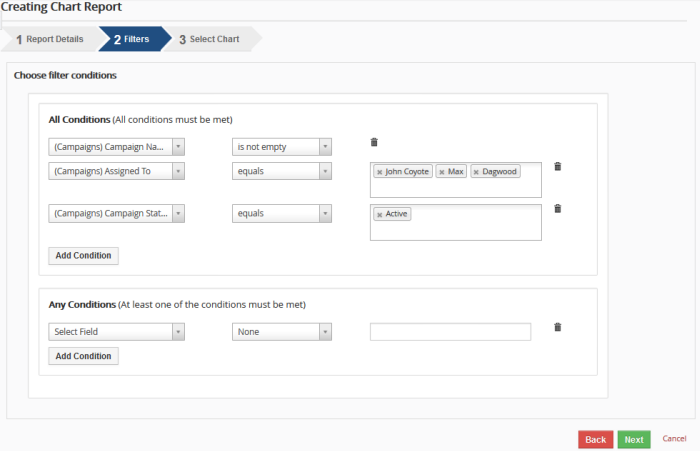
Records filtering conditions has been made very simple. Conditions are grouped into two blocks.
-
Provide condition to filter selected records. You can skip this step if you wish to create report on all existing records in selected module.

- Click 'Generate Report' button. The detail view of the report will be displayed.
- To edit existing report, place your mouse on the report name and click the 'pencil' icon and then generate the report by clicking 'Generate Report'.
OR
- Click on 'Customize' button in the detail view of the report.

A stepped report will be displayed.
To create a custom chart,
- Click 'All' > 'Reports'
- In the 'Add Report' drop-down select the 'Charts'
The 'Creating Chart Report' page
will be displayed.

- Step 1 - Give a name to the chart, and select the primary module (& related modules if required).
- Step 2 - Choose conditions to select data that needs to be plotted in a chart.

- Step 3 - Select the way the chart will be displayed.: Pie chart, Vertical bar chart, Horizontal bar charts or Line chat.
- Select Grouping field for X-Axis, and Data to be plotted on Y Axis (upto 3 data fields can be plotted on a line/bar chart).

-
Click 'Generate Chart'
To view the details of the report, click the report name.

You can customize the standard report as per your
requirements by clicking the 'Customize'
button in the report
page. Once customized,
you cannot revert to the default report.

This feature allows you to export your reports to .csv or .xlsx files. You will need to click on a corresponding button in the detail view of the record to export it. You can also print your reports by clicking on a print button in the detail view of the report.
Reports allows Export CSV, Export Excel option if the User have permission to export the records for Reports and the Primary module selected in the report.


