The Admin Console
The cWatch
admin console allows you to add networks and devices, create
protection settings, view dashboard statistics and more.

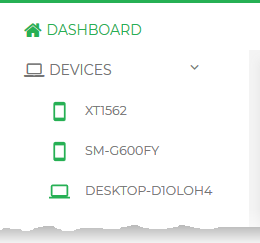
- The menu on
the left contains a link to the dashboard and lists all devices
added to your account.
- Click on a
device to view its details and edit its protection settings.
 
|
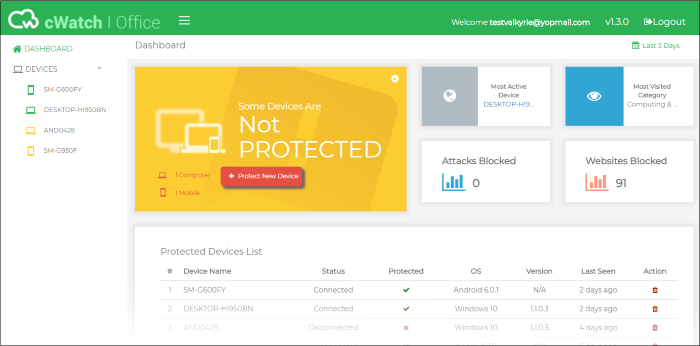
- Dashboard - Opens
the dashboard of your cWatch Office account. The dashboard shows
statistics on blocked websites on protected networks and devices.
You can also add new devices from here. See The
cWatch Office Dashboard for more details.
- Devices - Lists devices and
networks enrolled for cWatch protection.
The
color of the device icon indicates the state of its connection to
cWatch Office.
- Green
– Device is connected and protected
- Yellow
- Device is currently disconnected
- Gray - The registration of the device is pending
- Click
a device name to view an overview of device activity in the right
pane. The overview shows statistics on
websites blocked on the device. You can also edit device protection
settings from here. See The
Device Overview for more details.
|


