Verdict Dashboard
The Verdict dashboard shows a top-level summary of Verdict results on files that you have submitted.
This lets you
quickly view the total number of files uploaded, queried,
processed and in progress.
To view your dashboard
- Click your account name at the top-right and then 'Dashboard' from the left-hand menu
OR
- Click the hamburger icon at top-left then 'Dashboard'
- For example, the 'Today' stats might show that malware was detected on your devices.
However, your security software may already have handled those threats.
The 'Today' figure will return to zero at 00.00 AM the next day if the threats are no longer active.
Note: The charts in the dashboard are a historical record of malware that was found on your devices at a given time. They do not necessarily mean you have active malware on your devices right now, especially if you have security software installed to clean the threats.
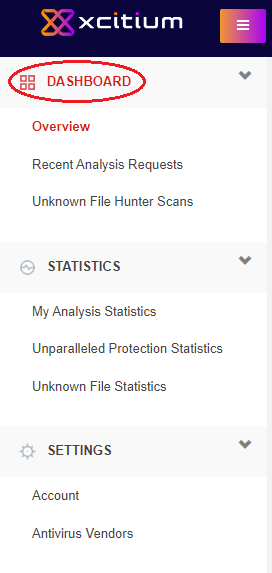
- Overview – Real-time charts and graphs showing key data about unknown files and threats on devices in your network. See Overview for more details.
- Recent Analysis Requests - Shows trust verdicts on files which you have recently uploaded to Verdict for analysis. You can download reports on each file, submit a file for testing on Virus Total and submit a file for human analysis. See Recent Analysis Requests for more details.
- Unknown File Hunter Scans - Verdict verdicts on files discovered and submitted by Xcitium's Unknown File Hunter (UFH) tool. Xcitium UFH is a lightweight scanner designed to find all unknown files on your network. You then have the option to upload these files to Verdict for analysis. See Unknown File Hunter Scans to find out more.
Recently Detected Malware - List detected malware which were submitted to Verdict for analysis. See Recently Detected Malware for more details.
To open the overview:
- Click the hamburger at top-left
- Click 'Dashboard' > 'Overview' on the left-menu
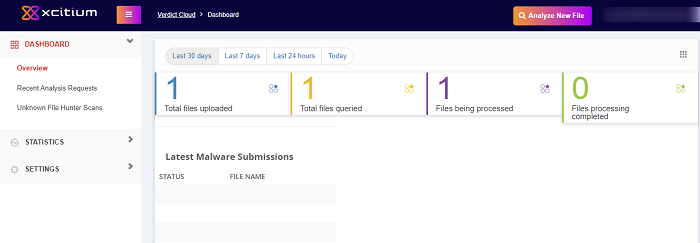
The 'Overview' contains the following items:
File Statistics
An overall summary of file totals:
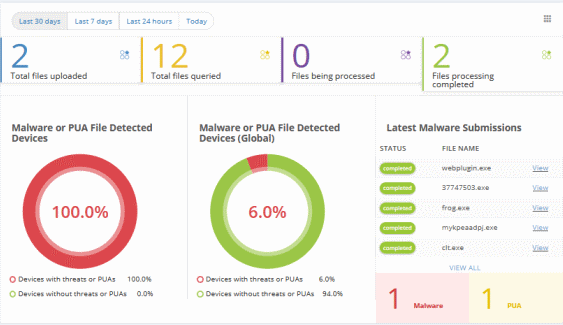
Total files uploaded – Number of files you have submitted using the Verdict web interface (direct upload).
Total files queried – Total number of files submitted by your account. This figure incorporates files submitted by direct upload and those submitted by Xcitium software and services like Unknown File Hunter, Forensic Analysis Tool, Xcitium Client Security and Xcitium Cloud Antivirus.
Files being processed – Number of files currently being analyzed by Verdict.
Files processing completed – Number of files which have been successfully analyzed.

You can view data on files submitted within the last 30 days / 7 days / 24 hours / today by clicking the appropriate link at the top of the interface.
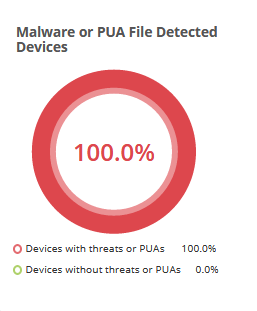
| Malware or PUA File Detected Devices Shows how many of your devices contain or contained malware/PUAs versus those that are clean. The chart is a history of malware found on your devices rather than a concrete indicator of currently active malware. For example, your security software may already have removed the malware shown in the 'Today' statistics. The statistics for 'Today' will reset at 00.00 AM. Place your mouse cursor over items in the legend to change the information displayed in the chart. PUA stands for 'Potentially Unwanted Application'. While not strictly speaking malware, these applications are often bundled with legitimate software and might have been installed without a user's knowledge. Often they have unclear objectives. An example is a browser toolbar which purports to offer weather advice, but which also serves adverts or tracks internet usage. |
|
|
|
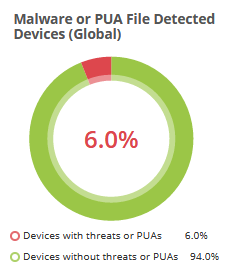
Malware or PUA File Detected Devices(Global) Place your mouse cursor over items in the legend to change the information displayed in the chart. |
|
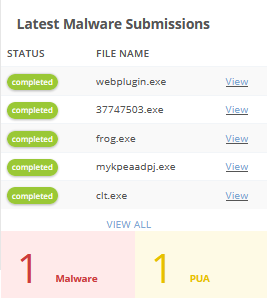
Latest Malware Submissions Shows the files you have most-recently submitted for analysis. Click 'View' to open a detailed report on an individual file. |
|
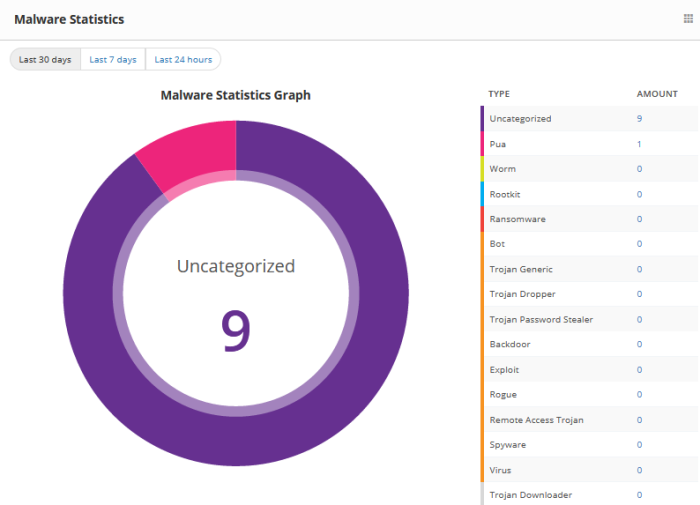
Malware Statistics
Shows the quantity of various malware types discovered on your devices. Example malware types include worms, rootkits, ransomware, and password stealers.
Place your mouse cursor over items in the legend to change the information displayed in the chart.
You can view data on malware found within the last 30 days / 7 days / 24 hours / today by clicking the appropriate link at the top of the interface.
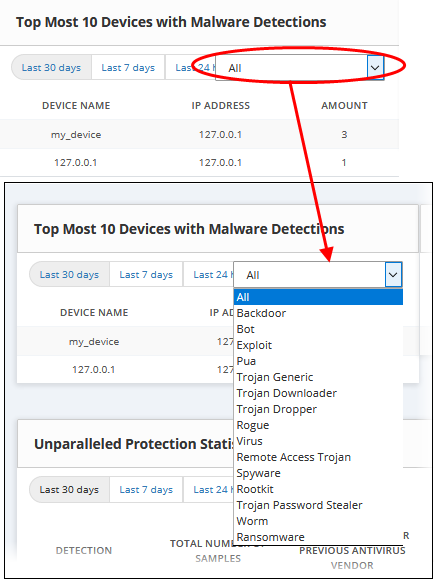
Top Most 10 Devices with Malware Detections
The 10 devices upon which most malware was found. The chart shows 'All' types of malware by default. You can choose specific types of malware using the drop-down to the right.
Top Most 10 Devices with PUA Detections
The 10 devices upon which most Potential Unwanted Applications were found.
PUA stands for 'Potentially Unwanted Application'. While not strictly speaking malware, these applications are often bundled with legitimate software and might have been installed without a user's knowledge. Often they have unclear objectives. An example is a browser toolbar which purports to offer weather advice, but which also serves adverts or tracks internet usage.
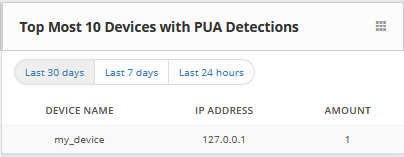
You can view data within the last 30 days / 7 days / 24 hours / today by clicking the appropriate link at the top of the interface.
Unparalleled Protection Statistics
Unparalleled protection shows files which Verdict found to be malware before any other vendor in the antivirus industry. The table shows data for zero-day malware and zero-day PUA's for both your account and for all Verdict users (global).
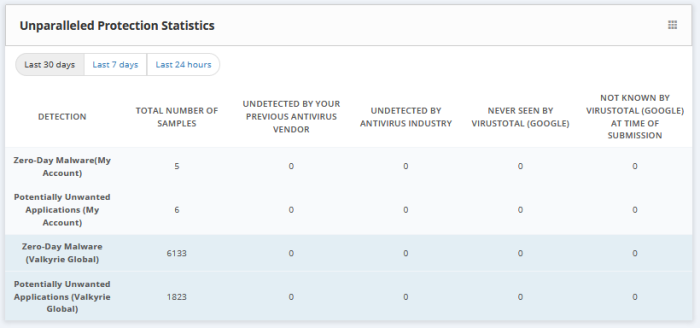
You can view data within the last 30 days / 7 days / 24 hours / today by clicking the appropriate link at the top of the interface.
Top 10 Queried Files
Shows the 10 files which have been most often submitted for analysis. The table shows the file name, the number of queries and the number of endpoints on which the file was found.
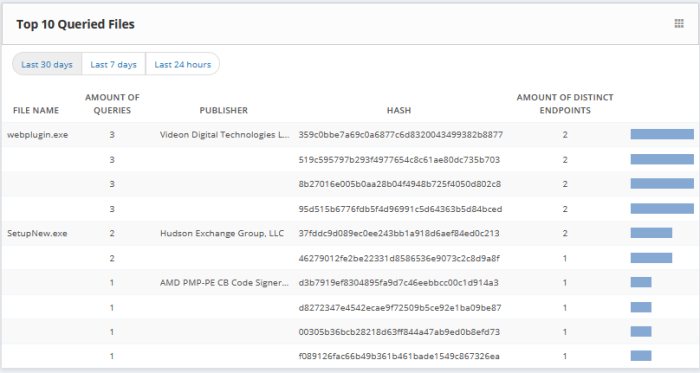
You can view data within the last 30 days / 7 days / 24 hours / today by clicking the appropriate link at the top of the interface.
Top 10 Product Vendors of Queried files
Shows the 10 software publishers who are responsible for most file queries. A single vendor may be the publisher of multiple individual files.

You can view data within the last 30 days / 7 days / 24 hours / today by clicking the appropriate link at the top of the interface.
Malware Files top 10 Contacted Domains/IPs
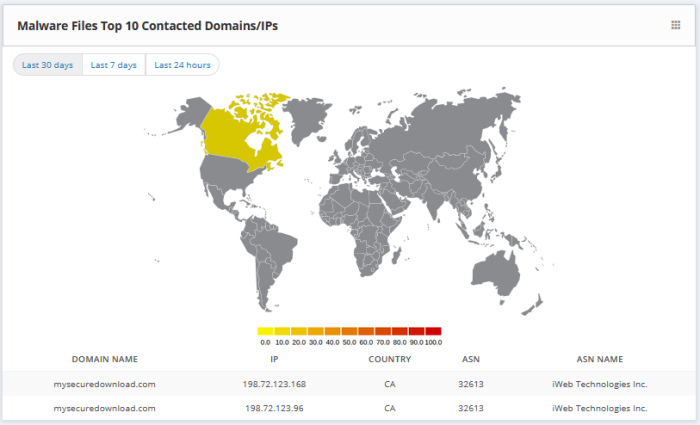
You can view data within the last 30 days / 7 days / 24 hours / today by clicking the appropriate link at the top of the interface.


