View Revenue Statistics
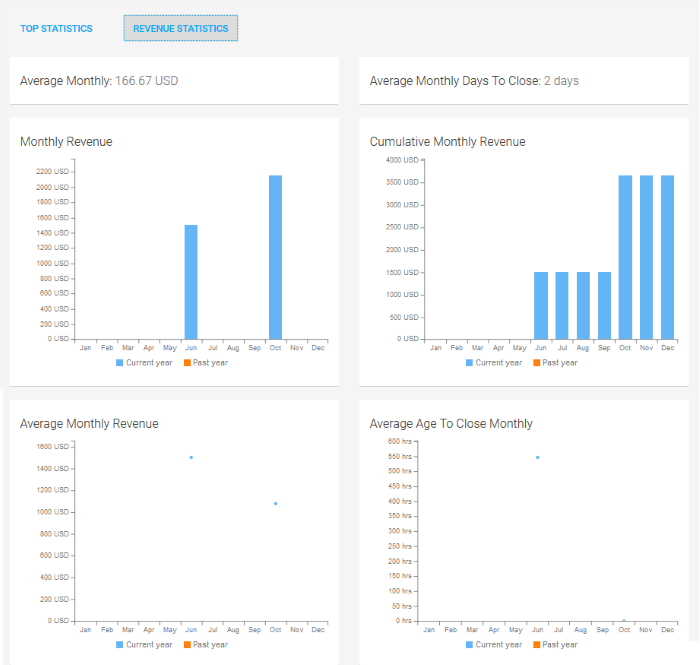
- The 'Revenue Statistics' report displays bar-charts of monthly revenue compared to previous years.
- Click 'Reports' from the left navigation
- Choose the 'REVENUE STATISTICS' tab from the top
An example is shown below.

- Average Monthly – Displays the average revenue generated per month for the current year
- Average Monthly Days to close – Displays the average of life-cycle time of quotes dealt per month, for the current year
The report contains four charts:
- Monthly Revenue - The bar-chart displays the income generated on each month of the current year and the previous year.
- Cumulative Monthly Revenue – The bar-chart revenue generated on a cumulative basis for each month of the current year and the previous year.
- Average Monthly Revenue – The graph displays the average monthly revenue calculated for each month of the current year and the previous year.
- Average Age To Close Monthly – The graph displays the average of time taken for closing quotes dealt in each month of the current year and the previous year.


