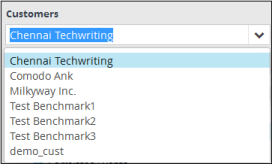
Long Term Analysis
Results for event queries (see
'Configure
Event Queries') are available for a maximum
of seven days. To analyze results older
than seven days you need to use the 'Long Term Analysis' interface.
Results are available for up to four weeks in the past.
- Click the 'Menu' button > 'Investigation' > 'Long Term Analysis'.
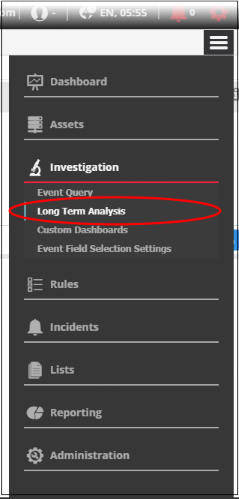
The 'Long Term Analysis' screen will open:
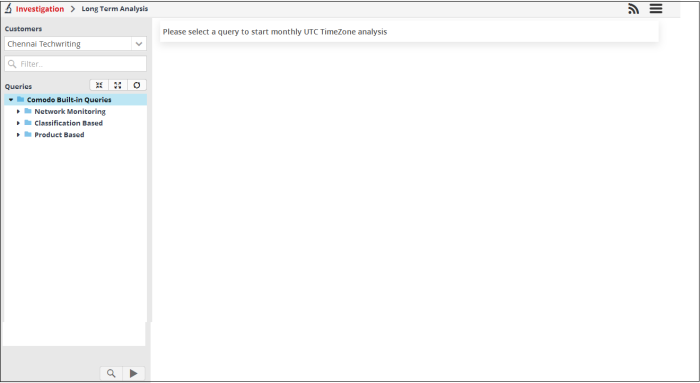
The default customer that was configured under the settings is shown in the left pane. A list of predefined and custom queries for the customer is shown under 'Queries'. The main panel will be blank and after pressing the play button at the bottom, will show the monthly results for the selected query.
|
Correlation Rules Management - Table of controls |
|
|---|---|
|
|
The 'Customers' drop-down allows you to select the customer for which you want to analyze the long term query results. |
|
|
Allows you to search for a particular query. Enter the name of the query fully or partially and click on the search icon or press 'Enter'. Queries matching the entered text will be listed. To view the full list of queries again, clear the search field and press 'Enter'. |
|
|
Expand, collapse or refresh the list of queries. Click the refresh button at the end to instantly update the query list. |
|
|
Allows you to preview the parameters of a selected query. |
|
|
Click this button to start the search for the selected query. |
To preview the parameters of a query
- Select a customer from the 'Customers' drop-down at the top of the left hand panel.
- Select the query for which you want to preview the parameters
- Click the search icon at the bottom of the left menu
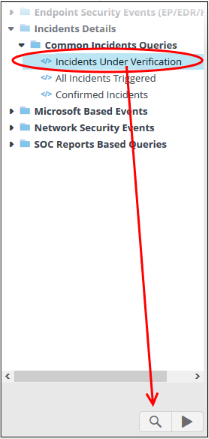
The preview of the selected query will be displayed.

Please note that you cannot edit or
update the query from this screen. Click 'X' to close the dialog.
To search for monthly query results
- Select the customer from the 'Customers' drop-down at the top of the left hand panel.
- Select the query for which you want to view the monthly results
- Click
the play button at the bottom of the left menu
The monthly analysis for the selected query will be displayed.
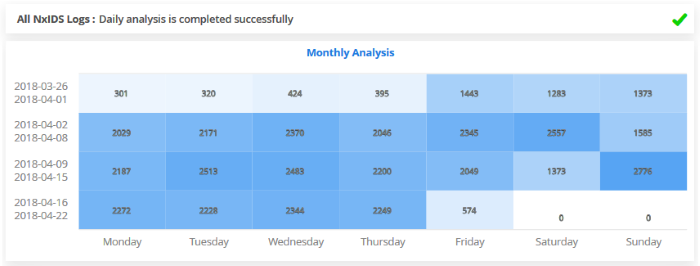
- The data will be shown as a heat map, displaying the number of events for the past four weeks.
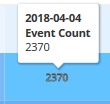
- Place your mouse cursor over an event count to view the date it occurred and the number of events.
To search query results for a selected day of the week
- Click on a day of the week to view the results for the selected query
The daily analysis graph details will be displayed below the monthly analysis table.
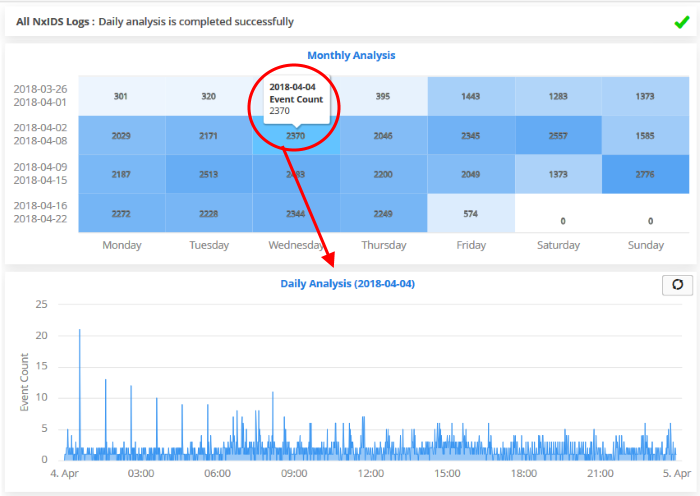
- The number of events is displayed on the 'X' axis
- The time of the events is shown on the 'Y' axis
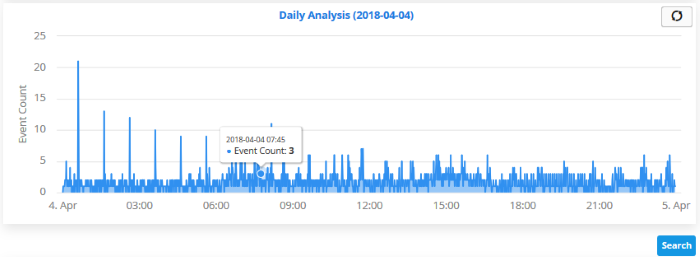
- Place your mouse cursor on a particular point to view the number of events at that time.
-
Click on a particular time to view more details in a table below the graph.
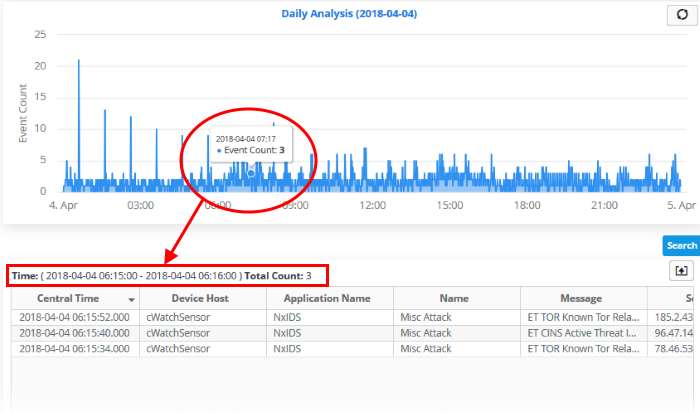
The table displays details of events that happened during the selected period. See 'View Results Table' in 'Configure Event Queries' for more information on event details.
- To view the full event results table for a particular day, click the day from the table. The 'Daily Analysis' for that particular day will be displayed.

- Click the 'Search' button.
The event results table for the selected date will be displayed:

Please note that only last 1000 events for the selected date will be displayed even if the number of events exceeds that number. If the results for a query exceeds 1000, it means that the query is not properly configured and should be reconfigured.
- Clicking on an event will display its details.
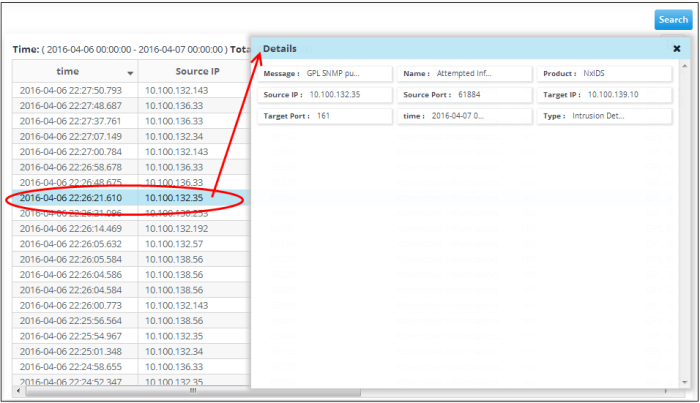
See 'View
Results Table' in 'Configure
Event Queries' for more information about event details.
To export a long term query result to a CSV file
- Click the 'Export' button above the results table header

The file will be downloaded to the default download folder.


