Manage Aggregation Rules
- The 'Aggregation Rules' interface allows you to log new events by configuring filters for sub-events and conditions that, when met, will create a new event.
- The aggregation rules filter lets you define highly granular event queries.
- For example, you can create an aggregation rule to generate a new event whenever a firewall event and access event for the same IP is detected. This event then can be queried from the Event Query' page under Investigation.
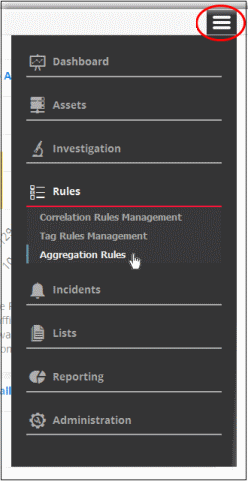
- To open the 'Aggregation Rules' interface, click the 'Menu' button from the top right, choose 'Rules' and then click 'Aggregation Rules'.
The 'Aggregation Rules' interface will open:
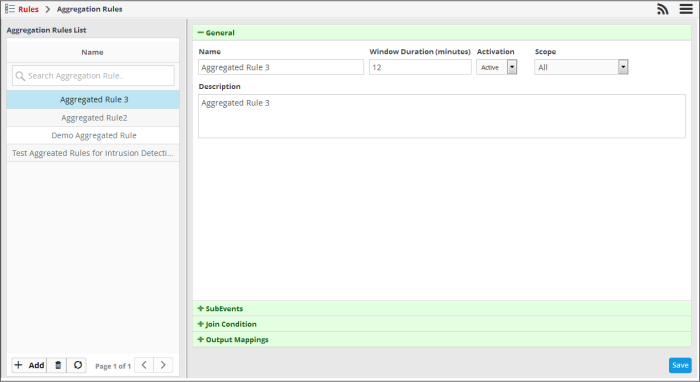
The left hand panel shows configured aggregation rules. The right panel shows details of the rule chosen from the list and allows you to configure the rule.
|
Aggregation Rules Management Interface - Table of controls |
|
|---|---|
|
|
Allows you to search for a particular aggregation rule. Enter the name of the rule fully or partially and click on the search icon or press 'Enter'. The rules matching the entered text will be listed. To view the full list of rules again, clear the search field and press 'Enter'. |
|
|
Allows you to add a new aggregation rule. |
|
|
Allows you to delete selected aggregation rules. |
|
|
The refresh button allows to instantly update the rules list. |
The interface allows administrators to:
You can create a new event from the output of configured sub-events queries and conditions.
To create a new aggregation rule
- Click
the 'Add' button at the bottom of the left pane
The rule configuration screen will open on the right. It has four sections:
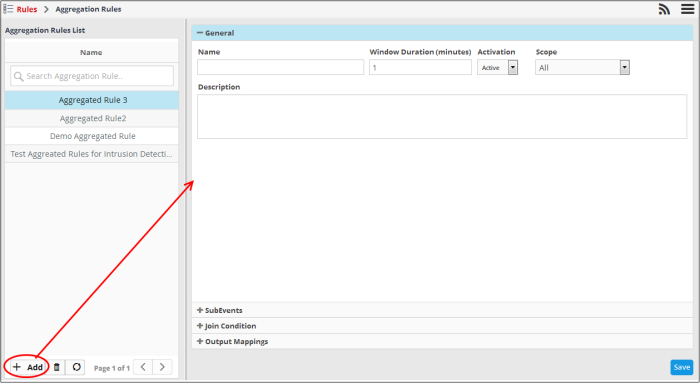
- General -
- Specify a name and description for the rule.
- Window duration (minutes) -
- Activation - Enable or disable the rule
- Scope - Select the customer to whom the rule should be applied.
- Sub Events - Allows you to define multiple event queries for the rule. The field values of the sub events will be used to check for conditions configured in 'Join Condition'.
- Join Condition - Allows you to configure field values that when matched in the sub events, a new event will be created per the output mappings. cWatch will check the field values of the sub events and if the join conditions are satisfied, then a new event will be generated.
- Output Mappings - Allows you to select the field values to be included in the output events generated if the join condition is true. The output events can be queried from the 'Event Query' interface.
- Click the 'General' stripe to open the general configuration area.

- Name - Enter a name for the rule
- Window Duration (minutes) - Enter the minimum duration (in minutes) for the join condition to be checked for the rule. For example, if you enter 5, the sub events join condition will be checked for every 5 minute cycle. If within the 5 minute window, say in the 1st minute, the join condition becomes true, an aggregated event is generated and the window is closed. The next cycle begins and so on.
- Activation - Choose whether you want the rule to be active or inactive from the drop-down
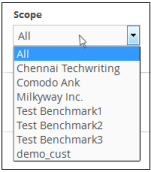
- Scope - Select the customer to whom the rule will be applied from the 'Scope' drop-down. Please note that you can apply the rule for all customers or any one customer. If you want to apply it to two or more customers, create a similar tag rule and apply it for each customer.
- Description - Enter an appropriate description for the rule.
Each sub event is constructed with a set of filter condition statement groups to identify the events. You can create multiple sub events for a rule. The 'Sub Events' stripe allows you to define filter statement groups for the rule. You can add filter statement groups by selecting saved queries and/or by manually defining them. Please note that you have to add at least two sub events to construct an aggregation rule.
- Click the 'Sub Events' stripe to open the 'Sub Events' area.
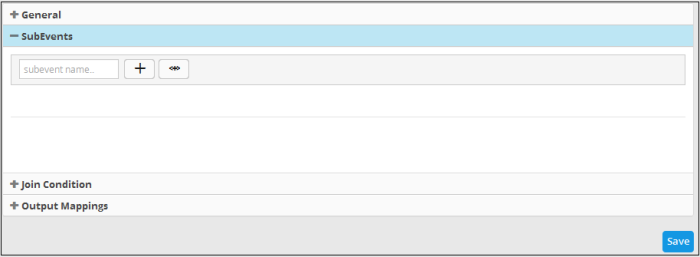
- To add a filter statement group for a sub event, enter a name for it in the 'Subevent name...' field
The next step is to add filter condition statement groups for the sub event. This can be done in two ways:
Selecting an Event Query and import filter statements:
- Click
the
 button after entering a name for the sub event.
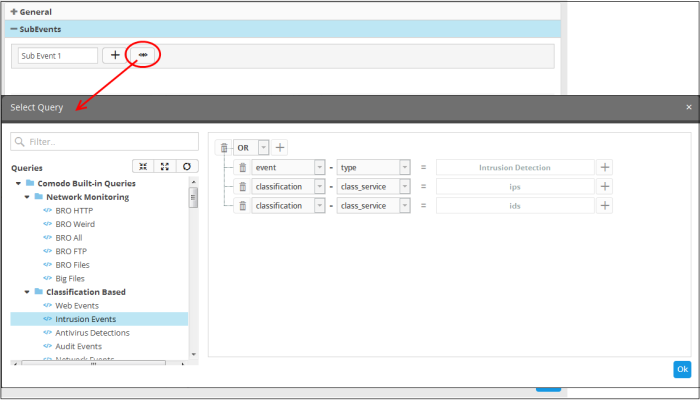
The 'Select Query' dialog will open with a list of pre-defined and custom event queries added for the customer in the left pane.
- Choose the query from the left pane.
The filter statements in the query will be displayed in the right pane.
- Click 'OK' to import the filter statements.
The sub event will be added with the group of filter statements from the query.
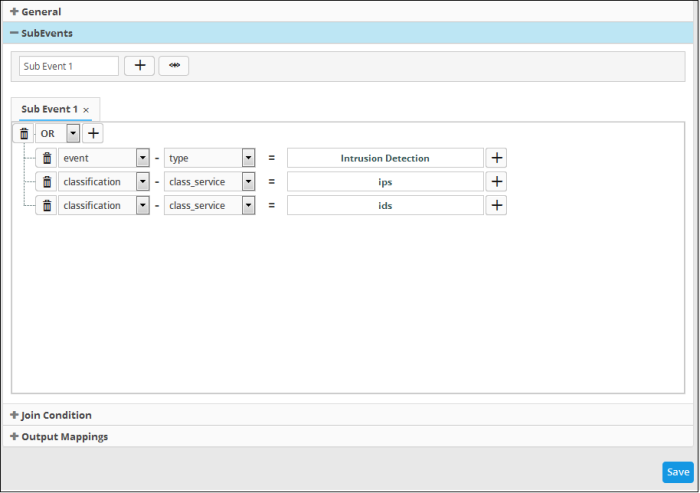
You can edit the group by adding new statement(s), changing fields/values and/or removing existing statements. See 'Manually defining filter statements for the group' given below for more details on construction of filter statements.
- Repeat the process to add more definitions from event queries. Please note that you have to add at least two sub events to construct an aggregation rule.
Manually Define Filter Statements for the Sub Event
- Click the button after entering a name for the sub event.
A tab to add the query fields for the definition will open.
Each rule definition is built with a set of filter statements that are connected with Boolean operators like 'AND', 'OR' or 'NOT'. Each filter statement contains the following components.
'Field Group' + 'Field' + 'Operator + 'Value'
- Field Group - The group to which the field specified as the filter parameter belongs.
- Field - The field in the event log entry by which you want to filter results
- Operator - Controls the relationship between the field and the specified value. Examples include 'Equals to', 'Does not equal to', contains, 'does not contain' etc.
- Value - The value for the field. Values can be entered manually or fetched from a pre-defined list which is managed in the 'List Management' interface.
- For example, if you choose a source IP (src_ip) as the field to be searched from network events, you can manually enter the IP address of the source of the connection request or choose a list containing a list of specified source IP addresses. See Lists for more details on pre-defined lists. See Lists for more details on pre-defined lists.
Examples:
-
To filter network connection events originated from an endpoint with IP address 10.100.100.100, build the filter statement as shown below:
'Source' + 'src_ip' + '=' + '10.100.100.100'
-
To filter network connection events originated from a set of endpoint whose IP addresses start with 10.100.100.xxx, build the filter statement as shown below:
'Source' + 'src_ip' + 'AB*' + '10.100.100
-
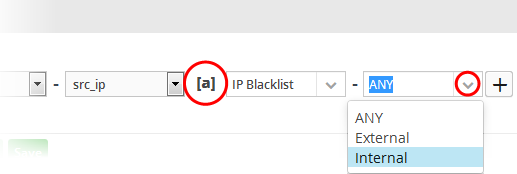
To filter network connection events originated from a set of endpoint whose IP addresses are defined in the 'Live List type' named 'Internal' under the 'Live List' named 'IP Blacklist' build the filter statement as shown below:
'Source' + 'src_ip' + '[a]' + 'IP Blacklist' + 'Internal'
You can create more complex queries by adding more filter statements and linking them using 'AND', 'OR', or 'NOT'. For example:
- To filter network connection events originated from an endpoint with IP address 10.100.100.100, and destined to another endpoint with IP address 10.100.100.120, build the filter statements with an AND combination as shown below:
'Source' + 'src_ip' + '=' + '10.100.100.100'
AND
'Destination' + 'dst_ip' + '=' + '10.100.100.120'

To manually add a filter statement group
- Choose the combination condition for the query(ies) to be defined from the drop-down at the top left. The options available are:
- AND
- OR
- NOT
- Click
the
 button beside the drop-down to add a query filter.
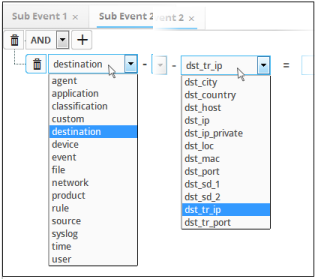
The 'Field Groups' drop-down and 'Fields' drop-down will appear. The 'Fields' drop-down will contain options relevant to the 'Field Group' chosen from the drop-down at the left.
- Choose the field group you wish to add to the filter from the 'Field Groups' drop-down.
The next field will display the fields available for the selected field group.
-
Choose the field from the second drop-down.
|
Tip: The descriptions of the Field Groups and the Field items under each of them, are available in Appendix 1 - Field Groups and Event Items Description. |
The next step is to choose the relationship between the field chosen and the value to be entered in the next field.
- To choose the relation, click on the relation symbol at the right of the 'Field' drop-down.
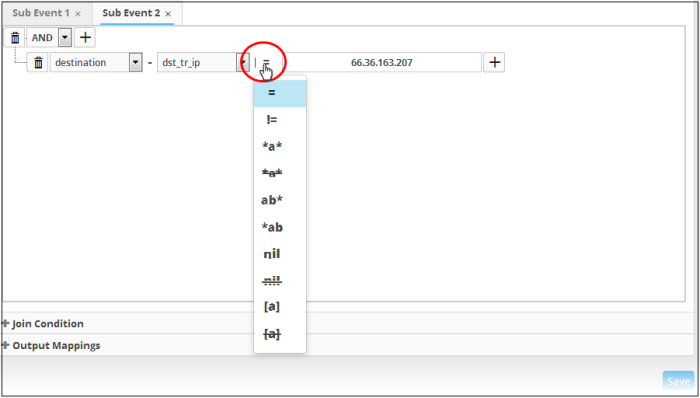
The types operators depends on the field chosen. The following table explains the various operator symbols:
|
Relation Operator |
Description |
Entering the value for the 'Field' |
|---|---|---|
 |
Equals to |
|
 |
Does not equal to |
|
 |
Greater than |
|
 |
Greater than or equal to |
|
 |
Less than |
|
 |
Less than or equal to |
|
 |
Contains |
|
 |
Does not contain |
|
 |
Starts with |
|
 |
Ends with |
|
 |
Is Empty |
|
 |
Is Not Empty |
|
 |
Is in List |
Allows you to configure the filter statement to fetch values for the field from a pre-defined list containing specific values for the field type. Background:
On selecting
All the values contained in the list will be included as values for the Field specified in the filter statement. |
 |
Not in List |
Allows you to configure the filter statement to search for the events that do not contain specific values from a pre-defined list. On selecting
|
- If you are adding values for source
parameters like source IP address, source port, source MAC etc., but
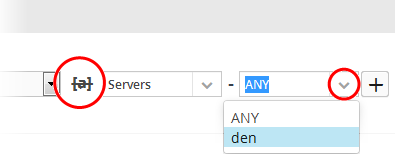
wish to reverse the parameter, click the switch
 icon that appears to
the right of the statement.
- The field group and the field selected will automatically switch from source to destination or vice-versa.
- For example, if you are specifying a live list containing values of source IPs for the source IP field, but want to change them to destination IPs, you can click the switch button.
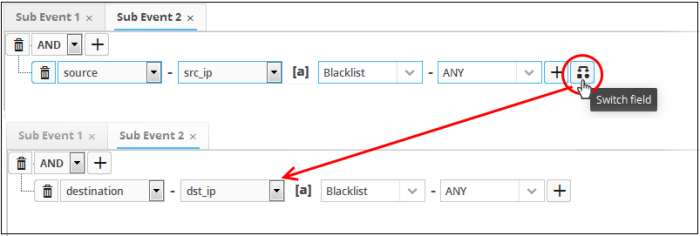
- Similarly
to add the switched condition to the existing query, click


- To
add more query filters under the same combination chosen in
the first step, click the
 button beside the same combination and
repeat the process.
- To
add a sub-filter statement, click the
 button beside the filter and
repeat the process.
- To set the relationship between each statement, use the drop-down menu.
- For example, the statements below will return events whose source ends with 10.100 OR .com AND whose destination is 86.105.227.125

-
To delete a filter, click the
 button beside it.
You can add multiple query definitions for a single sub event and these are tied together.
The next step is to define sub events join condition that, when true, a new event will be generated per the output mappings configuration.
Please note that you have to add at least two sub events in order to define a join condition. This section allows you to configure field groups and fields that when those values are equal in the sub events, then a new aggregated event will be generated as per the output mappings. For example if in the condition 'agent:agent_id' for sub event 1 is equal to 'agent:agent_id' for sub event 2 then the condition becomes true.
- Click the 'Join Condition' stripe to open the 'Join Condition' area.
The Join Condition screen will be displayed:
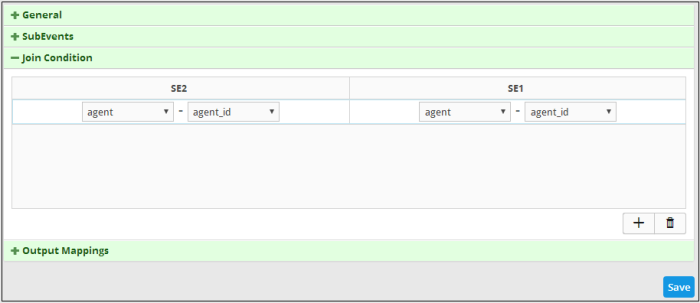
The number of columns displayed for 'Join Condition' depends on the number of sub events configured. For example, if you have configured three sub events, then the Join Condition will display field groups for three sub events allowing you to configure the condition. The above aggregated rule displays the Join Condition for two sub events and the selected values indicate that when the value of 'agent_id' is same for both the sub events then the condition becomes true. The column header displays the name of the sub events configured for the aggregated rule. When the condition become true, a new aggregated event will be logged and can be queried from the Event Query' page under Investigation.
To configure a join condition
- Choose the field group you wish to add to the filter from the 'Field Groups' drop-down.
The next field will display the fields available for the selected field group.
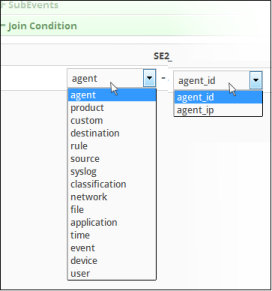
- Choose the field from the second drop-down.
|
Tip: The descriptions of the Field Groups and the Field items under each of them, are available in Appendix 1 - Field Groups and Event Items Description. |
- Repeat the same process to select the field group and fields for the available sub event(s)
- To
add more field groups and fields for the sub events, click the
 button at the bottom of the screen. Another row to configure the
field groups and fields for the sub events will be displayed.
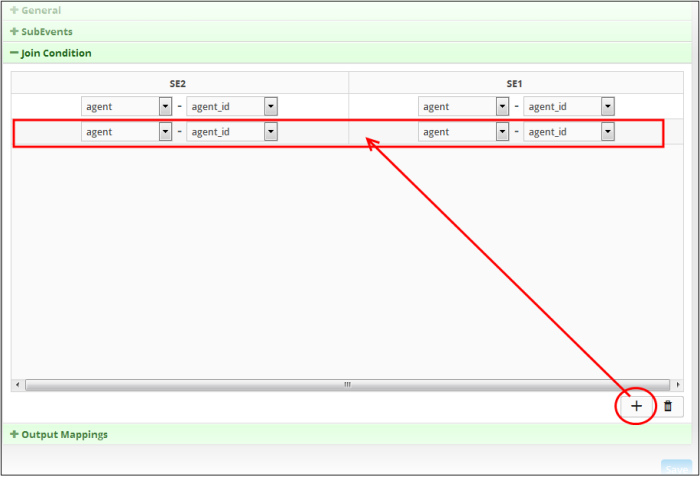
- Repeat the same process explained above to select the field group and fields for the available sub event(s) for each row.
Please note that you can add multiple rows for a Join Condition. The values in the same row should be equal for the Join Condition to be true. For example, the value of row 1 of sub event 1 should be equal to value of row 1 of sub event 2. Similarly the value of row 2 of sub event 1 should be equal to value of row 2 of sub event 2 and so on.
- To remove a join condition row, select it and click the trash can icon at the bottom
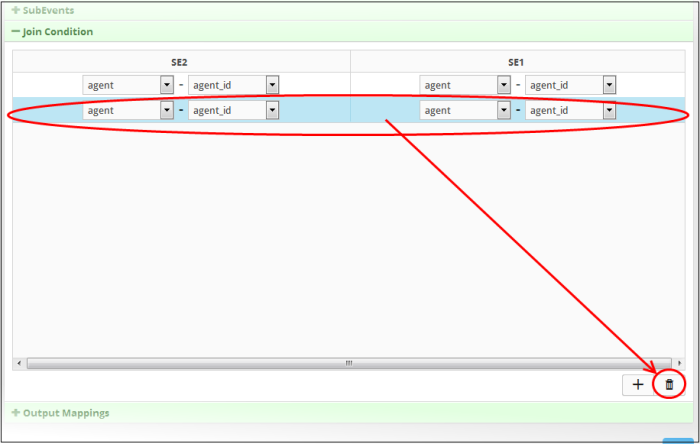
The row will be removed from the screen. After configuring the join condition for the sub events, the next step is to configure the fields that should be included in the aggregated events.
The Output Mappings area allows you to configure the field values that should be displayed in the aggregated events that are generated whenever a join condition for sub events becomes true. Please note that the details screen of an aggregated event will display the configured output field values including default values. These default values may vary for different aggregated events.
- Click the 'Output Mappings' stripe to open the 'Output Mappings' area.
The 'Output Mappings' screen will be displayed:
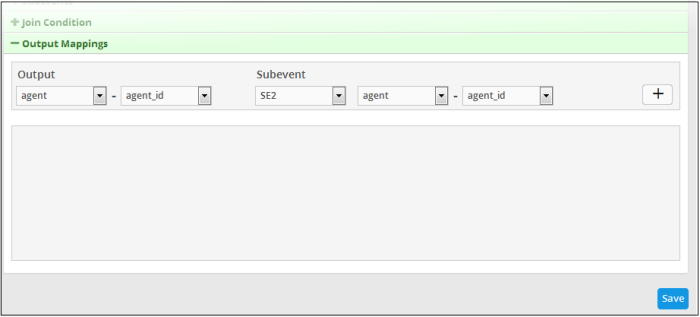
- Output – Allows you to configure the field that should be displayed on the details screens of an aggregated event
- Subevent – Allows you to select the value that should be displayed for the output field. The drop-down lists all the sub events added for the rule including 'Value' that allows to input a custom value.
To configure the output field
- Choose the field group from the 'Field Groups' drop-down from the 'Output' section
The next field will display the fields available for the selected field group.
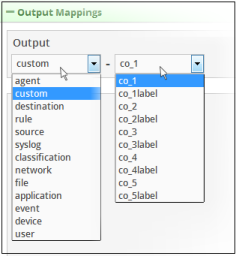
-
Choose the field from the second drop-down.
|
Tip: The descriptions of the Field Groups and the Field items under each of them, are available in Appendix 1 - Field Groups and Event Items Description. |
Next, you have to configure the sub event value that should be populated for the selected field under 'Output'.
The first drop-down under the 'Subevent' section displays all the sub events available for the rule.
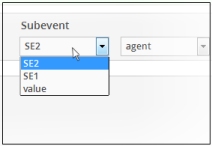
- Choose the sub event from the drop down. 'Value' allows you to input a custom value.
- Next, choose the field group from the 'Field Groups' drop-down
The next field will display the fields available for the selected field group.
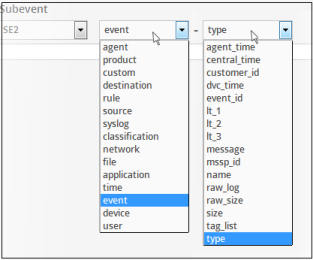
-
Choose the field from the second drop-down.
|
Tip: The descriptions of the Field Groups and the Field items under each of them, are available in Appendix 1 - Field Groups and Event Items Description. |
-
Click the
 button on the right after selecting the output parameters.
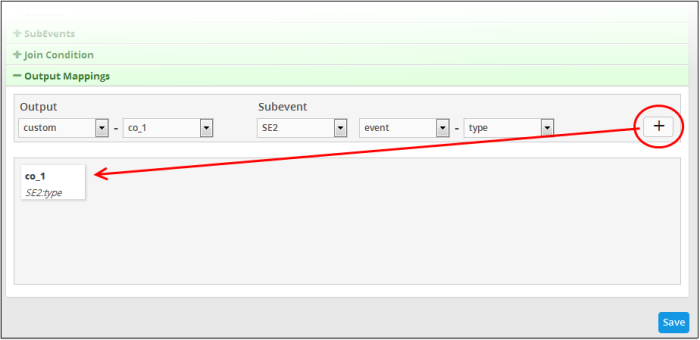
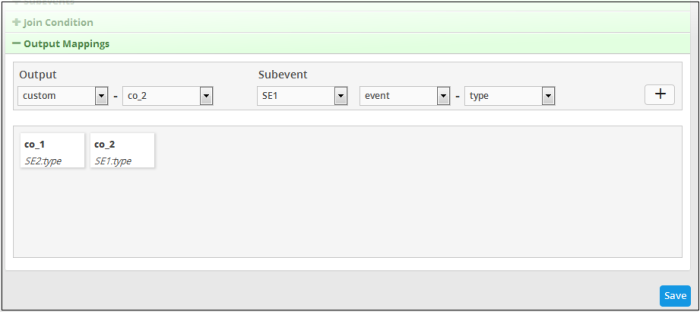
The output field with the configured field value will be displayed below the configuration area. The following example shows the field output values added for sub event 1 and 2. You can add as many output fields as required for the aggregated event.
-
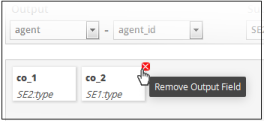
To remove an output field, place the mouse cursor over an output configuration and click the 'x' mark.
-
Click the 'Save' button.
The aggregation rule will be saved
and when the join condition is triggered, an aggregation event will
be generated and can be queried from the Event
Query' page under Investigation.
- To view an aggregated event that was triggered by an aggregation rule, click the menu button > 'Event Query' under 'Investigation. Select the customer that was applied to the rule under 'Customers' on the left pane.

In the 'Query Builder', select 'event' from the 'Field Groups' drop-down and 'type' from the 'Fields' drop-down. Select '=' operator and enter 'aggregated' in the text field. Select the search period from the 'Last...' drop down and click the 'Search' button.
The search results for the aggregated event query will open.
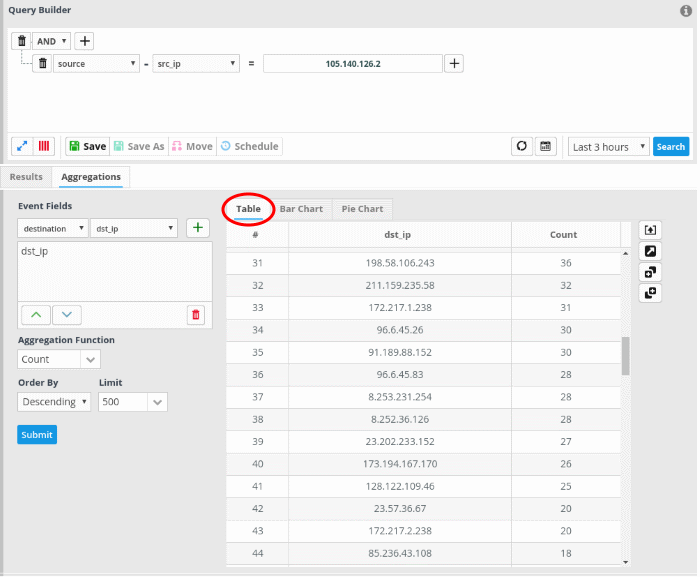
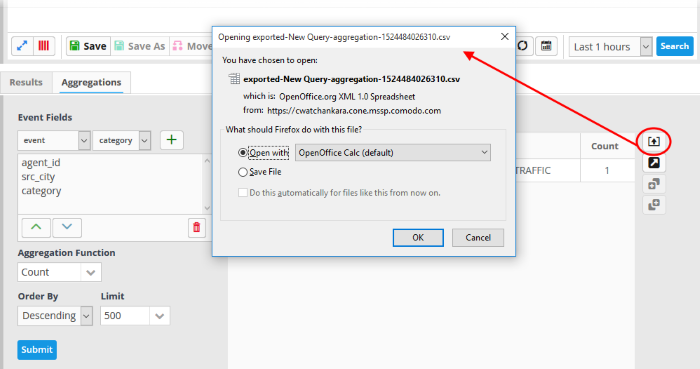
- Click the export
 button on the right of the table to generate a .csv file of the results.
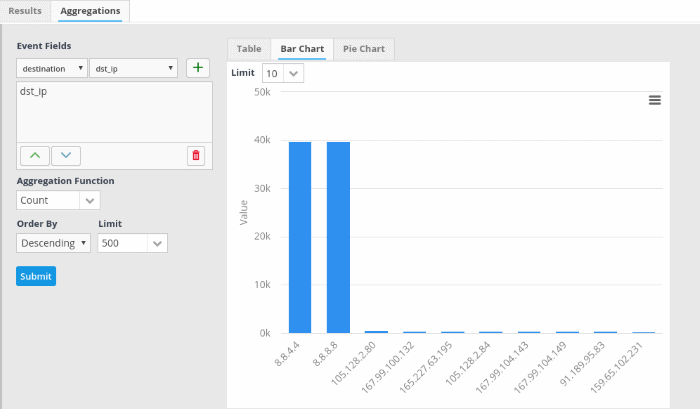
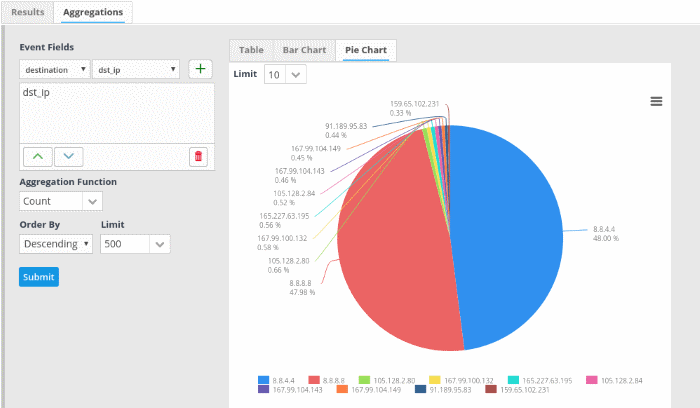
You can also view the graphical representation of the number of events from source ip to destination ip.
- Click the 'Bar Chart' tab to view the bar chart representation of the aggregated events.
- Click the 'Pie Chart' tab to view the pie chart representation of the aggregated events.
To re-arrange the event fields,
- Select the field you want to re-positon
- Click
the up/down
 arrow button on the bottom left of the 'Event Fields'
pane.
cWatch Analytics
- You can view more graphical representations of the aggregated results using cWatch Analytics.
- This interface helps you view a unique filtered chart by entering the specific values in the field as desired from event query.
- You can view the both the combination of fields or either of the fields entered in the right hand side filter to view the desired chart by clicking Boolean operators AND/OR present below the aggregated fields
- To
view more graphical representations of the aggregated results, click
the 'Go to cWatch Analytics' button

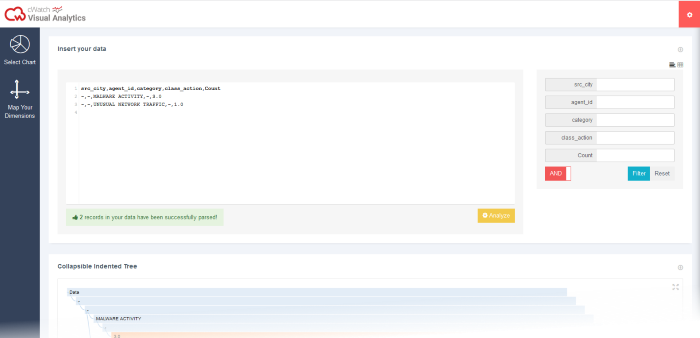
The analytical result for fields chosen in aggregated results will open. The parsed analysis results will also be displayed in this interface.
- To view this result in various types of charts, map the aggregated result fields, by clicking 'Map Your Dimensions' window on the left panel.
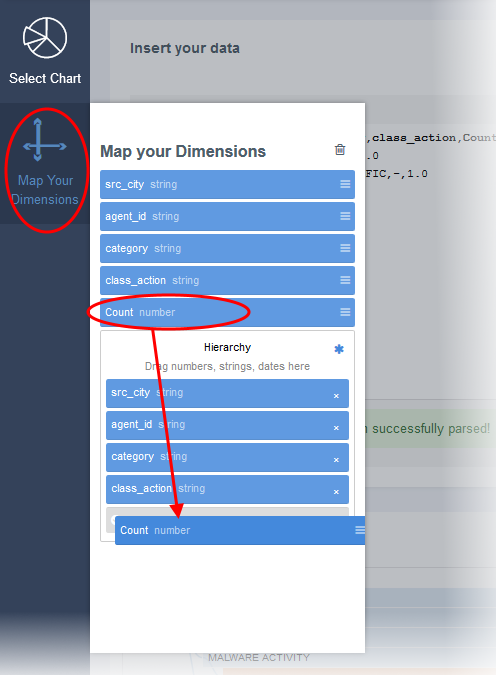
- Select the field you want to map and then drag and drop the parameter to the 'Hierarchy' below in the order you want it to be represented in the chart
- To view specific events in a graph, enter the fields displayed on the right of the interface and click 'Filter' to view the graph.
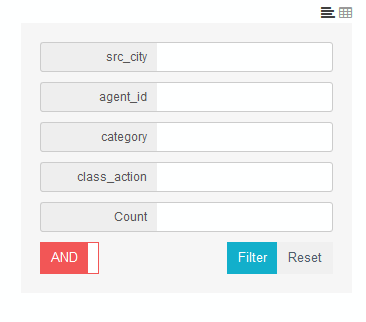
- Click 'Reset', to view all events of aggregated results
- To
view data input in text format, click

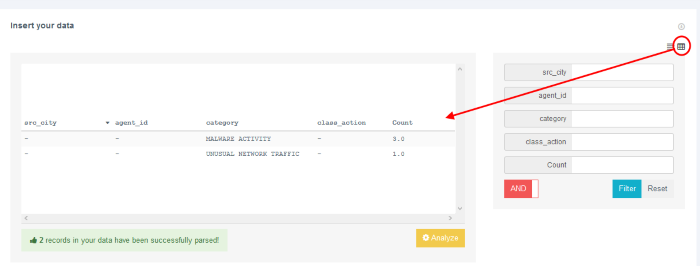
- To
view data input in table format, click

- Click the 'Select Chart' window to view the various types of charts that appropriately fits your event data inputs
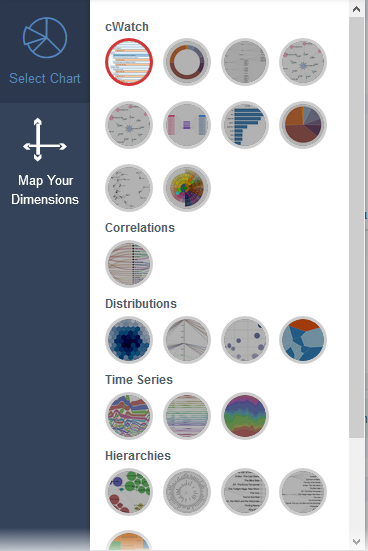
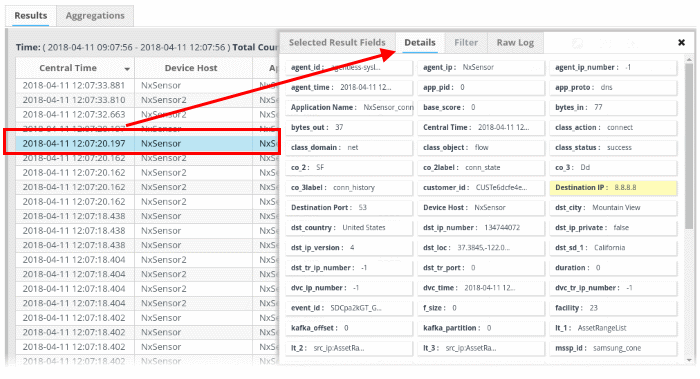
Clicking on an aggregated event will open details with configured and default output values.
- To add a particular event from the aggregated result to the current query, click
- To add a particular event from the aggregated result as a new query, click

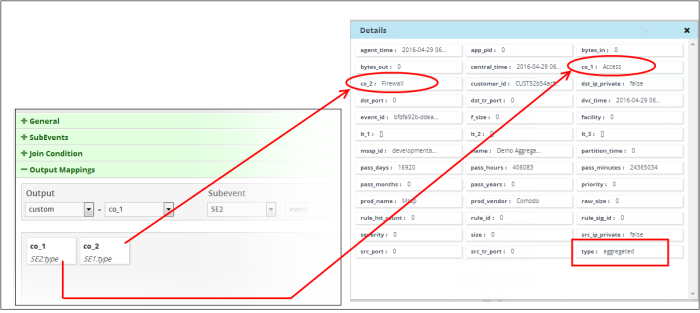
The following screenshot shows the output fields and values that were configured for an aggregated rule in the details screen of the aggregated event that the rule triggered. The 'event type' that were configured for sub event 1 and sub event 2 are Firewall and Access respectively.
You can save the aggregated events and use it for correlation rules in order to create incidents. See 'Query Management', Managing Correlation Rules' and 'Managing Incidents' for more details.
- Select the aggregation rule that you want to edit from the list.
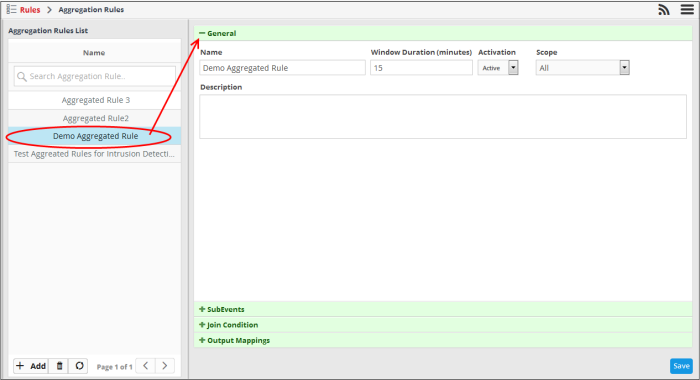
- General – Edit the name of the rule directly in the name field. Modify the other parameters as required. The process is similar to adding a new rule. Click here for more details about configuring the general section.
- Sub Events – Click 'SubEvents' to open the sub events configuration area. Modify or remove the sub events as required. The process is similar to configuring new sub events. Click here for more details about configuring sub events.
- Join Condition – Click 'Join Condition' to open the join condition configuration area. You can modify or remove join conditions as required. The process is similar to configuring new Join Conditions. Click here for more details about configuring sub events.
- Output
Mappings – Click 'Output Mappings' to open the output mappings
configuration area. You can edit existing current outputs, remove or
add new outputs. The process is similar to configuring new Output
Mappings. Click here for more details about configuring output mappings.
- Click the 'Save' button for the changes to take effect.
Please note that aggregated events triggered by aggregated rules prior to their modifications will not be affected.
- Select the aggregation rule that you want to remove from the list.
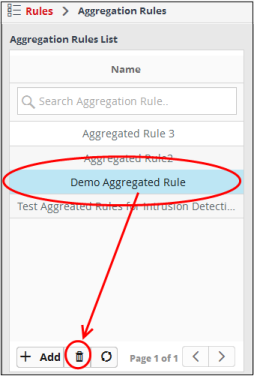
The rule will be removed from the list. Please note that the aggregated events triggered by aggregated rules prior to their removal will not be affected.


