Manage Correlation Rules
- Correlation rule management allows you to create rules which monitor the network for certain events.
- Events which match these rules are called 'Correlated Incidents'. These are automatically assigned to admins for further action.
- Correlation rules are created by defining query groups and aggregation parameters based on the event you want to capture. Each query group can be created by selecting saved 'Event Queries' and/or by adding new queries.
- The output from a correlation rule is also created as an event which can be queried from the 'Event Query' interface.
- Each rule can be configured with 'Output Mappings' that define the fields shown in the 'Events Query' interface.
- You can even configure a rule to just to create output events and not generate alerts.
- Also, selected field values of the outputs of a correlation rule can be used to update entries in live lists. Live lists contain values that can be used as parameters in a query or a rule.
- If a list is updated, the updated values are automatically reflected in the queries or rule which use the list. See Live Lists, for more details on managing Live Lists.
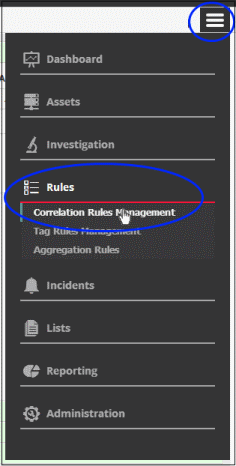
- Click the 'Menu' button > 'Rules' > 'Correlation Rules Management' to open the interface:
The 'Correlation Rules Management' interface will open:
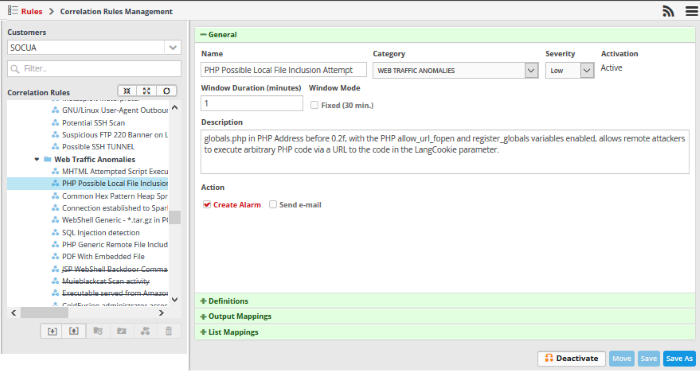
The left-hand panel shows predefined correlation and custom rules for the selected customer. The right-hand panel show rule details and allows you to configure the rule. Rules are added to their respective folders based on their category.
|
Correlation Rules Management - Table of controls |
|
|---|---|
|
|
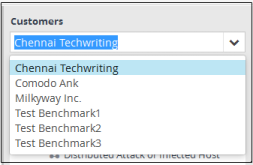
The 'Customers' drop-down allows you to select the customer for which you want to manage correlation rules. |
|
|
Allows you to search for a particular correlation rule. Enter the name of the rule fully or partially and click on the search icon or press 'Enter'. The rules matching the entered text will be listed. To view the full list of rules again, clear the search field and press 'Enter'. |
|
|
Allows you to expand or collapse the list of rules. To collapse, click the first button and to expand it, click the second button. Click the refresh button at the end to instantly update the rules list. |
|
Allows you to add a new category folder for adding the rules. |
|
|
Allows to edit the name and description of a 'Correlation Rules' folder |
|
|
Allows you to a add new correlation rule under the chosen folder. |
|
|
Allows to delete rules folders or rules. |
|
|
|
Allows you to import saved rules. |
|
|
Allows you to export rules. |
The interface allows administrators to:
Manage a Correlation Rules Folder
The
correlation rules folder contains a collection of rules of specific
category. Every new rule must be placed in a rules folder.
Creating a correlation rules folder
The predefined and custom rules added for the customer is displayed as a folder tree structure in the 'Correlation Rules' pane.
- Choose
the parent folder to create a new sub-folder and click the
 button.
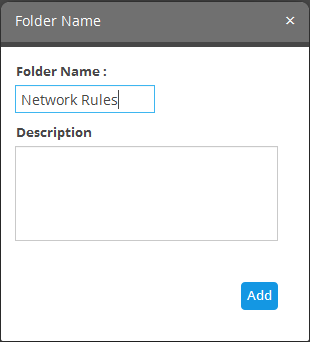
- Enter a name for the rules folder in the 'Folder Name' field
- Enter a description for the category of rules to be added to the new folder
- Click the 'Add' button
The folder will be saved and displayed on the left side.
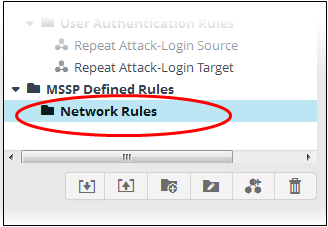
The relevant correlation rules can now be placed under the newly created folder. See 'Manage a Correlation Rule' section for more details.
Editing a correlation rules folder
-
Select the folder and click the
 button
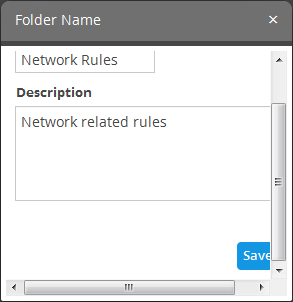
- Edit the details as required and click the 'Save' button
Deleting a correlation rules folder
- To
delete a correlation rules folder, select it and click the
 button.
A confirmation dialog will appear.

-
Click 'Yes' in the In the confirmation dialog. Please note all the rules in the folder will also be deleted.
Configure
a Correlation Rule
- Admins can create correlation rules in order to identify potentially harmful events. A event that meets the conditions of a rule will generate an 'Incident'.
- A rule is created by adding rule definitions with groups of filter statements and aggregation parameters for aggregating the events that are detected by the rule.
- Incidents will be assigned to the admin responsible for the customer.
- The detection of events based on a rule is also created as an event, that could be queried from the 'Event Query' interface.
- You can configure the values to be fetched for the fields for the output events generated by the rule every time.
- This allows you to further refine queries and rules based on output events. See Output Mappings for more details.
- Select the customer from the 'Customers' drop-down on the left side.
- Select the appropriate rule category folder or create a new correlation rule folder under which you want to create a correlation rule.
- Click
the
 button
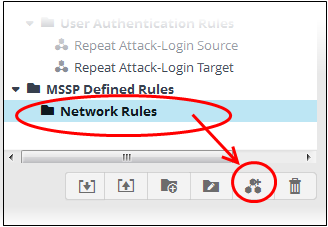
The configuration screen for creating the new rule will be displayed in the right hand side panel. It has four sections:
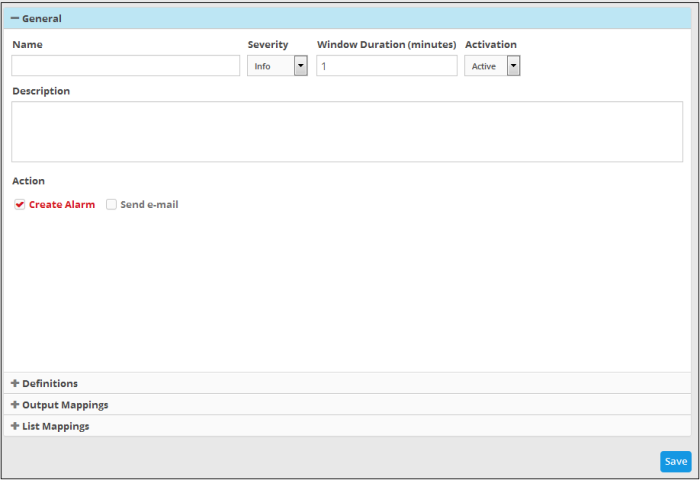
- General - Allows you to specify the name and description for the rule, category, select the severity level, window duration for rule, to set rule active or inactive and set whether or not to create an Incident when this rule is met.
- Definitions - Allows to define the queries for the rule and select aggregation parameters for grouping identified events and more.
- Output Mappings - Allows you to select the field values to be included in the output events generated based on the rule. The output events can be queried from the 'Event Query' interface (Optional).
- List Mappings - Allows you to map live lists to which the selected field values of the events detected by the rule is to be updated (Optional).
General
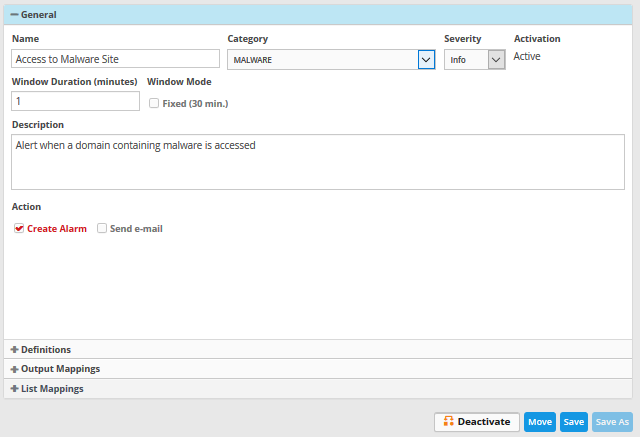
- Name - Enter a name for the rule
- Category - Select the type of rule. These options can be customized in the 'Incident Category Management' interface. The default categories are:
- Authentication Anomalies
- Anomalies in privileged user account activities
- Anomalies specific to endpoint and backend
- Check for known APS
- Correlated
- DNS Request Anomalies
- Malware Activity
- Malware
- Manual
- Scheduled Query
- Unusual Network Traffic
- Unpatched for Vulnerable Systems or applications
- Web traffic anomalies
- Severity - Choose the severity level that will be assigned to the incident that matches the rule. The options available are:
- Info
- Low
- Medium
- High
- Critical
- Window Duration (minutes) - Enter the minimum duration (in minutes) for the event to be identified as an incident based on the rule.
- Activation - Choose whether you want the rule to be active or inactive from the drop-down
- Description - Enter an appropriate description for the rule. The Description entered in this field will appear as the 'Summary' in the incident generated by the rule.
- Create Alarm - Configure whether or not an 'Incident' is to be created and an alert is to be sent to the administrator, when the rule is met. If selected, the rule creates an incident and an output event which can be queried from the 'Event Queries' interface. Else the rule creates only the output event and does not create an Incident.
- Send e-mail – Select this check-box if an email alert should be sent to the administrator when an incident is created. See Adding Users in 'Managing Users' for more details about configuring email address.
Definitions
Each rule is constructed with a set of filter condition statement groups to identify the events and generate alarms. The definitions stripe allows to define filter statement groups and aggregation parameters for the rule. You can add filter statement groups by selecting saved queries and/or by manually defining them.
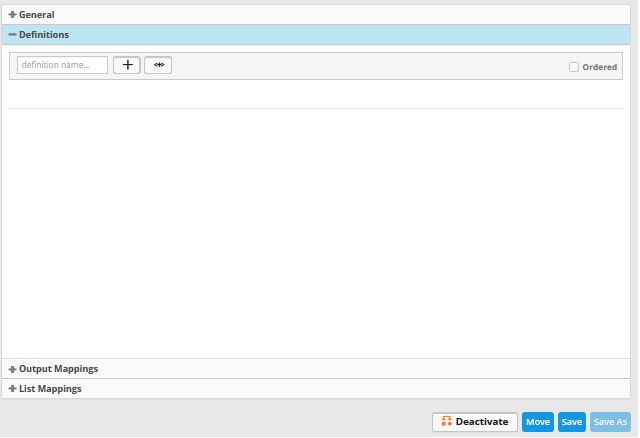
- Click the 'Definitions' to open the 'Definitions' area.
-
To add a filter statement group as a rule definition, enter a name for the rule definition.
The next step is to add the filter condition statement groups to the definition. This can be done in two ways:
Selecting an Event Query and import filter statements:
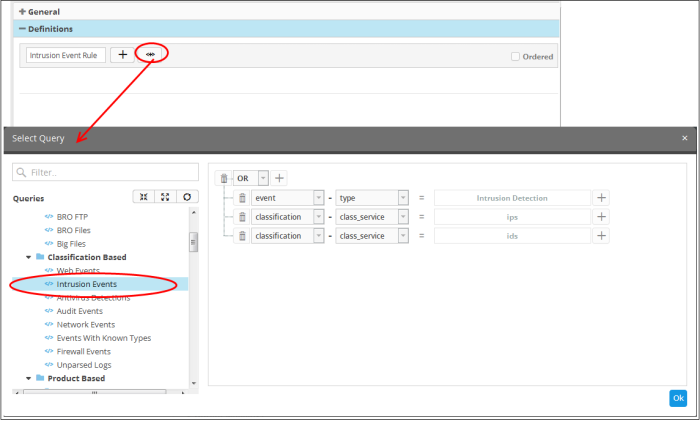
The 'Select Query' dialog will open with a list of pre-defined and custom event queries added for the customer in the left pane.
- Choose the query from the left pane.
The filter statements in the query will be displayed in the right pane.
-
Click 'OK' to import the filter statements.
The rule definition will be added with the group of filter statements from the query .
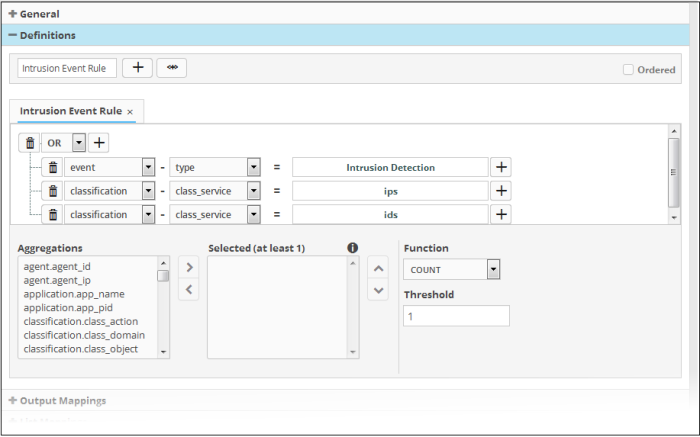
You can edit the group by adding new statement(s), changing fields/values and/or removing existing statements. For more details on construction of the filter statements, see 'Manually defining filter statements for the group' given below.
-
Repeat the process to add more definitions from event queries.
Manually defining filter statements for the group
- Click the
 button after entering a name for the rule definition.
A tab to add the query fields for
the definition will open.
Each rule definition is built with a set of filter statements that are connected with Boolean operators like 'AND', 'OR' or 'NOT'. Each filter statement contains the following components.
'Field Group' + 'Field' + 'Operator + 'Value'
- Field Group - The group to which the field specified as the filter parameter belongs.
- Field - The field in the event log entry by which you want to filter results
- Operator - Controls the relationship between the field and the specified value. Examples include 'Equals to', 'Does not equal to', contains, 'does not contain' etc.
- Value - The value for the field. Values can be entered manually or fetched from a pre-defined list which is managed in the 'List Management' interface. For example, if you choose a source IP (src_ip) as the field to be searched from network events, you can manually enter the IP address of the source of the connection request or choose a List containing a list of specified source IP addresses. Refer to the section Lists for more details on pre-defined lists.
Examples:
-
To filter network connection events originated from an endpoint with IP address 10.100.100.100, build the filter statement as shown below:
'Source' + 'src_ip' + '=' + '10.100.100.100'
-
To filter network connection events originated from a set of endpoint whose IP addresses start with 10.100.100.xxx, build the filter statement as shown below:
'Source' + 'src_ip' + 'AB*' + '10.100.100
-
To filter network connection events originated from a set of endpoint whose IP addresses are defined in the 'Live List type' named 'Internal' under the 'Live List' named 'IP Blacklist' build the filter statement as shown below:
'Source' + 'src_ip' + '[a]' + 'IP Blacklist' + 'Internal'
You can create more complex queries by adding more filter statements and linking them using 'AND', 'OR', or 'NOT'. For example:
- To filter network connection events originated from an endpoint with IP address 10.100.100.100, and destined to another endpoint with IP address 10.100.100.120, build the filter statements with an AND combination as shown below:
'Source' + 'src_ip' + '=' + '10.100.100.100'
AND
'Destination' + 'dst_ip' + '=' + '10.100.100.120'
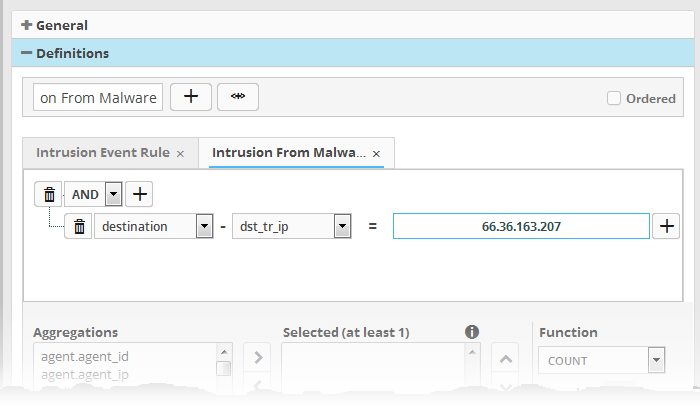
Manually add a filter statement group
- Choose the combination condition for the query(ies) to be defined from the drop-down at the top left. The options available are:
- AND
- OR
- NOT
- Click
the
 button beside the drop-down to add a query filter.
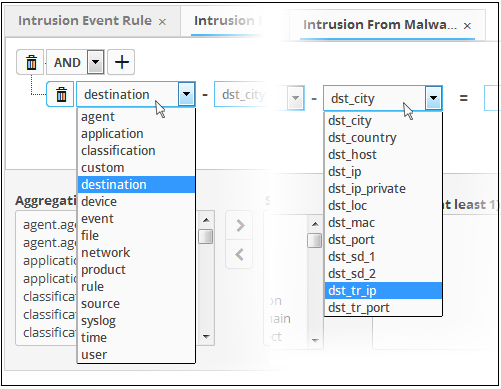
The 'Field Groups' drop-down and 'Fields' drop-down will appear. The 'Fields' drop-down will contain options relevant to the 'Field Group' chosen from the drop-down at the left.
- Choose the field group you wish to add to the filter from the 'Field Groups' drop-down.
The next field will display the fields available for the selected field group.
-
Choose the field from the second drop-down.
|
Tip: The descriptions of the field groups and the field items under each of them, are available in Appendix 1 - Field Groups and Event Items Description. |
The next step is to choose the relation between the field chosen and the value to be entered in the next field.
- To choose the relation, click on the relation symbol at the right of the 'Field' drop-down.
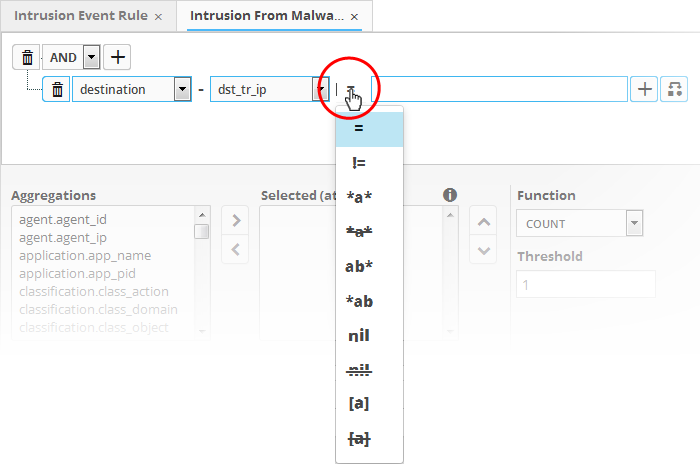
The types operators depends on the field chosen. The following table explains the various operator symbols:
|
Relation Operator |
Description |
Entering the value for the 'Field' |
|---|---|---|
 |
Equals to |
|
 |
Does not equal to |
|
 |
Greater than |
|
 |
Greater than or equal to |
|
 |
Less than |
|
 |
Less than or equal to |
|
 |
Contains |
|
 |
Does not contain |
|
 |
Starts with |
|
 |
Ends with |
|
 |
Is Empty |
|
 |
Is Not Empty |
|
 |
Is in List |
Allows you to configure the filter statement to fetch values for the field from a pre-defined list containing specific values for the field type. Background:
On selecting
All the values contained in the list will be included as values for the Field specified in the filter statement. |
 |
Not in List |
Allows you to configure the filter statement to search for the events that do not contain specific values from a pre-defined live list . On selecting
The results will display all events that do not contain the values in the lists. |
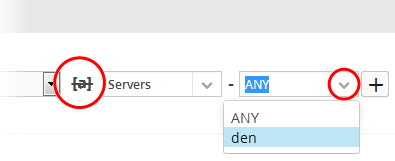
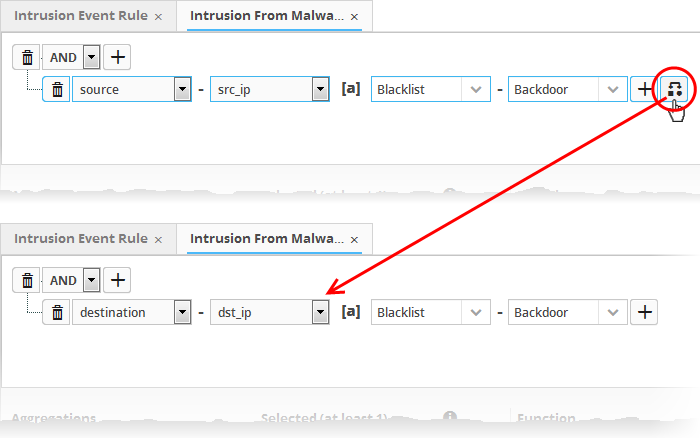
If you are adding values for source
parameters like source IP address, source port, source MAC etc., but
wish to reverse the parameter, click the switch icon  that appears to
the right of the statement. The field group and the field selected
will automatically switch from source to destination or vice-versa.
For example, if you are specifying
a live list containing values of source IPs for the source IP field,
but want to change them to destination IPs, you can click the switch
button.
- To
add more number of query filters under the same combination chosen
in the first step, click the
 button beside the same combination and
repeat the process.
- To
add a sub-filter statement, click the
 button beside the filter and
repeat the process.
- To set the relationship between each statement, use the drop-down menu.
- For example, the statements below will return events whose source ends with 10.100 OR .com AND whose destination is 86.105.227.125

- To
delete a filter, click the
 button beside it.
You can add multiple query definitions for a single rule and these are tied together.
- To add a new definition, enter the name of the new definition and add the filter statements as explained above.
- If you want the rules engine to process the definitions of the rule in order, select the 'Ordered' check-box.
- For example, under the first tab you can create a rule that checks for a brute force attack on a destination IP and in the second tab you can create a rule for intrusion detection.
- The rules engine checks for brute force attack and intrusion events. If any destination IP in the second tab matches the destination IP in the first tab, then an incident is created. Note - the number of selected aggregates should be equal for all tabs in order to correctly define the fields in the 'Output Mappings' section.
- For example, if you select 4 aggregate fields in the first tab, then all other tabs for the rule should also have 4 aggregate fields.
- Incidents are logged and can be queried from the 'Event Query' interface.
- For example, if you want the rule to search the source details from where the event occurred, then you have to select the appropriate event value in the 'Aggregations' box and move it to the 'Selected' box.
- Select the required values from the 'Aggregation' box and move them to the 'Selected' box by clicking
button.
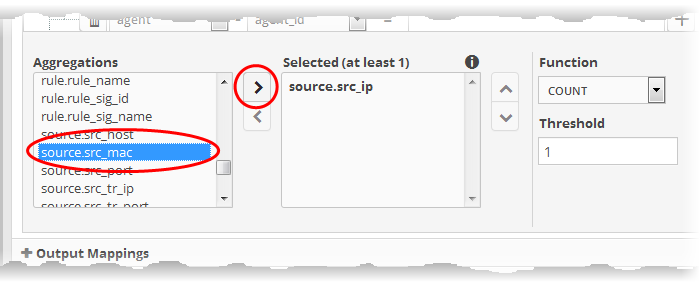
- To
remove a value added to the 'Selected' box by mistake, select it and
click the
 button.
- To
reorder in the values in the 'Selected' box, select them one by one
and click the
 or
or  buttons.
The next step is to define the 'Aggregation Function' and 'Aggregation Threshold' for the defined query. The 'Function' drop-down has three options:
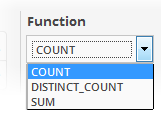
- COUNT - Select this if the incident is to be generated if the number of events that met the queries in the definition reach a certain number and enter the number in the Threshold field that appears on selecting this option.
- DISTINCT_COUNT - Choose this for the definition that checks for a range of events, for example, different source IPs to a single IP, choose the event items in the 'Distinct Field' combo boxes and enter the value in the 'Threshold' field.
- SUM - Choose this for the definition that checks for a numeric value, for example, number of bytes transferred or the rule hit count, select the event item in the 'Sum (Count)' field and enter the value in the 'Threshold' field.
You can create any type of rules as required for your customers. For better insight into rules creation, please check out the built-in predefined rules on the left side of the 'Correlation Rules Management' screen.
Output Mappings
- In addition to generating an 'Incident', cWatch Network generates a new event as output event every time events are detected as per a correlation rule.
- The output event can be queried from the 'Event Query' interface and its details can be used to generate further event queries for the customer.
- The 'Output Mappings' area allows
you to define the values to be fetched for selected fields of the
output event from the respective input events detected by the rule.
- You can choose only values that are common to all the input events that generated an 'Incident' as per the rule.
To configure output mappings for the rule
- Click the 'Output Mappings' Stripe to open the 'Output Mappings' area.
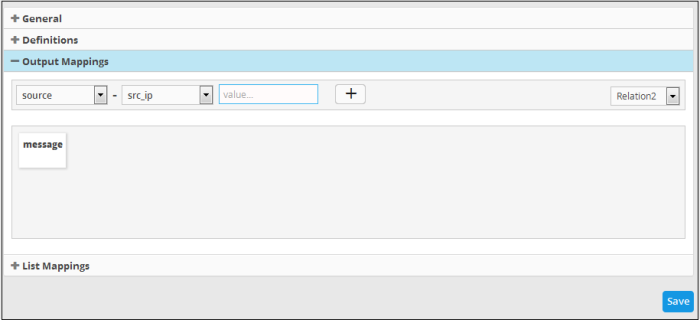
- Choose the Field to be configured for the output event by selecting the Field Group from the first drop-down and the field from the second drop-down.
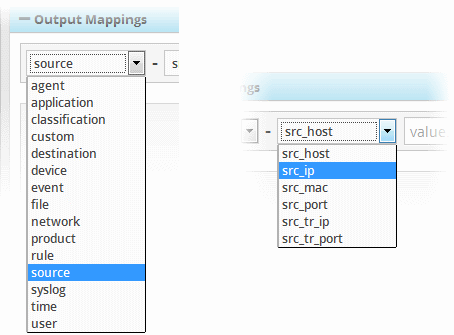
- In the 'Value' field, select the variable from the 'Relation' drop down at the far end that will fetch the value of the selected aggregate field in the 'Definitions' tab. The variable will be in the format ~r:1, ~r:2 and so on. For example selecting 'Relation1' from the drop down will auto fill ~r:1' in the value field. The variable '~r:1' will fetch the value of the first selected aggregate parameter, the variable '~r:2' will fetch the value of the second selected aggregate parameter and so on. If you enter some text, the field value will be static for that field for the new event generated on correlation.
- Click
the
 button to add the field value.

If you enter some text, the field
value will be static for that field for the new event generated on
correlation. For example, to enter a message for the 'Message' field,
choose 'Event' > 'Message' from the drop-downs and enter the
message in the third field . Click the  button to add the field.

- Add
more fields to fetch the values for, by repeating the same
procedure.
List Mappings
- Each Live List managed from the 'Lists' > 'Live List Management' interface, is configured to contain a list of defined values of a specific field value.
- The live lists can be used to provide values for respective fields in event queries or in correlation rules relieving the administrator to enter several values for a single field one by one.
- Also, when a list is updated with addition of new values or removal of existing values, the query/rule in which it is used is automatically updated, hence the administrator need not modify the query/rule every time for changes in values.
- The values in a list can be populated in two ways:
- Manual - The administrator can manually enter the values for the field in the respective list, from the 'Live List Content Management' interface, accessible by clicking 'Lists' > 'Live List Content Management' from the navigation menu.
- Automatic - From the events detected by a correlation rule. The administrator can map a rule to Live Lists and configure the fields of the events from which the values are to be updated to the respective list.
See Live
Lists for more details on managing Live
Lists.
- The 'List Mappings' area allows you
to choose the Live Lists to which the selected field values of the
events detected by the rule are to be automatically updated.
- As a prerequisite, you should have chosen the field values to be collected, as the aggregation parameters for the query defined in the rule.
- For example, if you want to collect the source IP addresses from the events identified by a rule that detects access to malware domains, in a live list that contain list of IP addresses of infected endpoints, you can map the respective live list to the rule and configure for the values of source IP address fields of the events to be fed to the list. The 'Source IP' field should have been set as a aggregation parameter in the query defined for the rule.
To map live lists to a rule
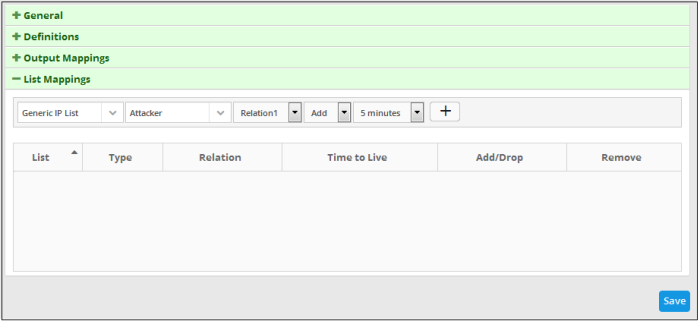
- Click the 'List Mappings' Stripe to open the 'List Mappings' area.
-
Choose the list to be updated by selecting the 'List' from the first drop-down and the 'List Type' from the second drop-down.
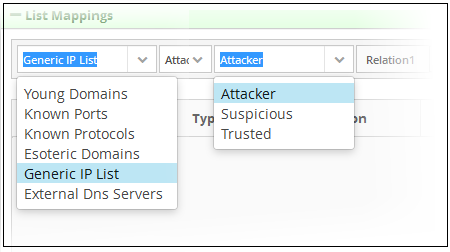
More details on Lists and List Types are available in the chapter Live Lists.
-
In the 'Relation' field, select the variable that will fetch the value of the selected aggregate field from the 'Definitions' area. The variable will be in the format ~r:1, ~r:2 and so on. For example selecting 'Relation1' from the drop down will auto fill ~r:1' in the relation column. The variable '~r:1' will fetch the value of the first selected aggregate parameter, the variable '~r:2' will fetch the value of the second selected aggregate parameter and so on. Care should be taken that the field values contained in the specified list should be same as the aggregate parameter chosen by entering the relation parameter.
For example, If the list contains Source IPs, and if the 'source.src_ip' is chosen as first aggregate parameter for the rule, then for collecting the source IPs from the events identified by the rule, select 'Relation1'.
- Select 'Add' if the output is to be populated in the Live List Content interface. Select 'Drop' to remove the output from the Live List Content interface. For example, if the output value of an IP is 87.250.255.234 and if this value exists in the live list contents, then this will be removed from the content list.
- Choose the validity period for the value in the live list from the Time To Live (TTL) drop-down that appears next. The options available are from '5 minutes' to 'No Limit'. On lapse of the TTL period, the value fetched to the list by the rule will be automatically deleted.
- Click
the
 button to add the list mapping.
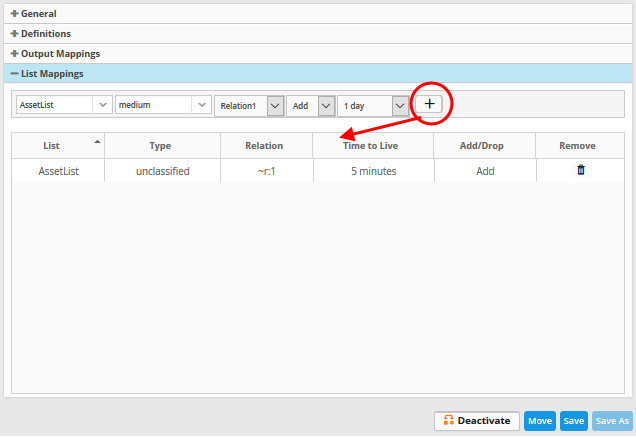
- Repeat the process to add more number of list mappings to the rule to fetch values from different fields for different live lists.
To remove a list mapping entry
added by mistake or that is no longer needed, click the ![]() icon under
the 'Action' column for that mapping entry.
icon under
the 'Action' column for that mapping entry.
- Click the 'Save' button, to save your rule for the customer.
- Click the 'Save As' button, to create a new correlation rule
- Click the 'Deactivate button, to disable the rule
- Click the 'Move' button, to change the folder of the current rule
The rules engine checks the events from the logs and if it matches the rule, generates an alert and creates an incident created. Also a new event is generated which will have the selected field values selected in the 'Output Mappings' area. If there are more than one query definition tabs are added for a rule, please make sure the number of selected aggregates is equal for all the tabs in order to correctly define the fields in the 'Output Mappings' section. For example, in the 'Definitions' section if you select 4 aggregate fields in the first tab, then all other tabs for the rule should also have 4 aggregate fields.
Editing a correlation rule
Correlation rules can be edited at anytime to change the name, query definitions, output mappings and list mappings.
To edit a rule
- Choose the customer from the 'Customers' drop-down at the top of the left panel.
The predefined and custom rules added for the customer is displayed as a folder tree structure in the 'Correlation Rules' pane.
-
Choose the rule to be edited.
The configuration panel for the rule is displayed at the right.
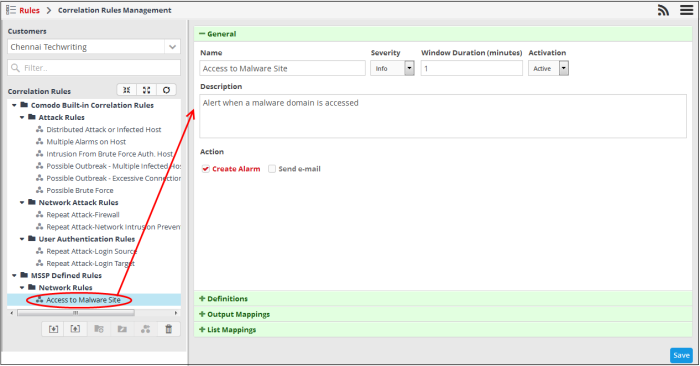
- Edit the rule as required. The procedure is same as adding a correlation rule. See creating a correlation rule for more details.
- Click
the 'Save' button to save your changes.
Deleting a correlation rule
- To
delete a correlation rule, select it and click the
 button
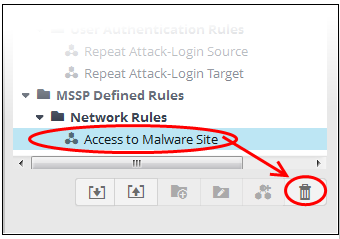
A confirmation dialog will appear.

-
Click 'Yes' in the confirmation dialog to remove the rule.
Exporting
Correlation Rules
- cWatch Network allows administrators to save correlation rules, which are defined from event queries, in order to use them for other customers.
- The imported queries or rules can be used as is or altered to suit the requirements of the customer. You can export a rule folder or a particular rule.
- Please note - exported event queries can only be imported to their respective sections.
- For example, event queries exported from the reports section can only be used in the report section. Also the values in the filter items in the exported events for tagged and list events will be set to default values.
To export a rule or rule folder
- Select the customer from the 'Customers' drop-down at the top of the left hand side panel.
- Choose the rule or rule folder to be exported, from the 'Rules' list at the left.
- Click the 'Export' button at the bottom
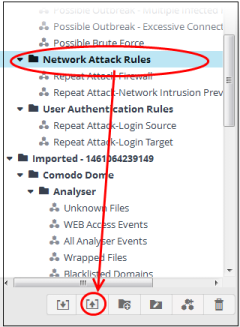
The saved rule(s) can be imported for use with another customer account.
Importing Correlation Rules
Administrators can import saved correlation rules to use them for other customers.
The imported rules can be used as is or altered to suit the requirements of the customer.
Please note - exported event queries can only be imported to their respective sections.
For example, event queries exported from the reports section can only be used in the report section. Also the values in the filter items in the exported events for tagged and list events will be set to default values.
To import a query or query folder
- Select the customer from the 'Customers' drop-down at the top of the left hand side panel for which you want to import the saved queries
- Click the 'Import' button at the bottom
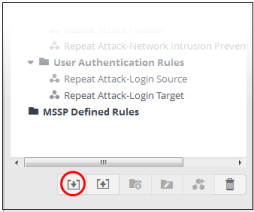
-
Navigate to the location where the rules file is saved.

-
Select the file and click 'Open'
The rule or rules folder will imported and will be listed under 'Imported' folder.
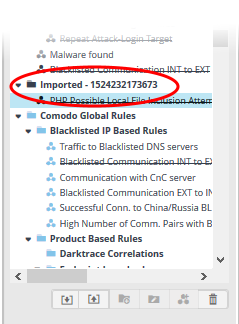
You can use the rules as it is or alter according to your requirement. Please note you can also import saved event queries and configure the mandatory settings, that is, 'General' and 'Definitions'.


