Web Overview
The web overview contains data about the websites visited by your enrolled networks and devices.
- Click 'Overview' > 'Web Overview' to open
the section
_3.png)
'Web Overview' contains the following tiles:
MSP customers can view statistics for particular customers. Possible data ranges are from the last 12 hours to the previous 7 days.
Shows the websites which were most often visited by users in your protected networks.
- The X-axis shows the name of the domain. The Y-axis shows the number of requests from endpoints in your networks or roaming devices.
- Place your mouse cursor over a bar to view further details.
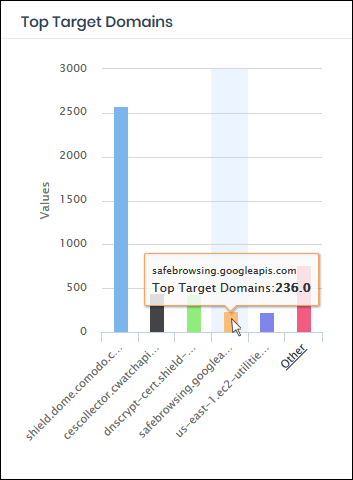
The chart shows the top five domains by default. Click 'Other' to view the next five domains.
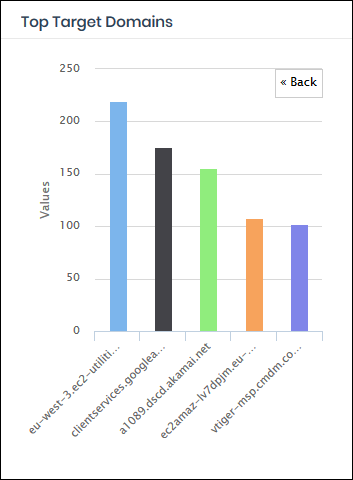
- Click 'Back' to return to the original view
- Click a particular bar to view logs pertaining to access requests to the domain. See 'View Logs' for more details
Roaming Agent Web Browsing Trend
Shows the number of domain access requests by roaming devices over time.
- Results are available from the last 12 hours up to a maximum of 7 days
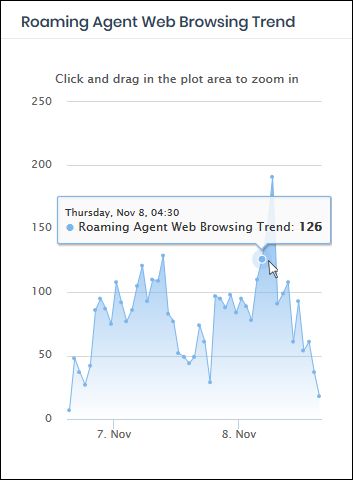
- Click and drag on the chart to zoom into a particular time period
- Click 'Reset Zoom' to return to the full chart
- Click a particular point on the chart to view logs of the domain access requests. See 'View Logs' for more details.
Shows those websites that were most often blocked by your security policies.
- The X-axis shows the name of the domain. The Y-axis shows the number of requests from endpoints in your networks or roaming devices.
- Place your mouse cursor over a bar to view further details.
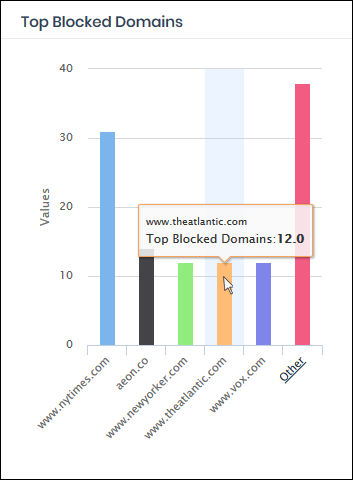
- By default, the chart shows top five domains. Click 'Other' to view the next five domains.
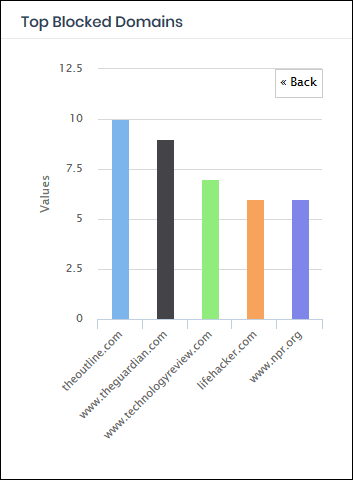
- Click 'Back' to return to the original view.
- Click
a particular bar to view access requests for the domain. See 'View
Logs' for more details.
Top Blocked Domains from Networks
Shows the websites that were most often blocked on your managed endpoints.
- Place your mouse cursor over a bar to view further details.
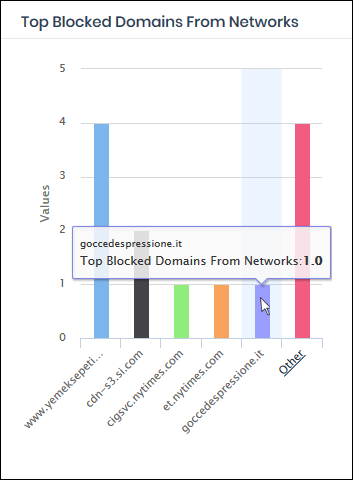
- By default, the chart shows top five domains. Click 'Other' to view the next five domains.
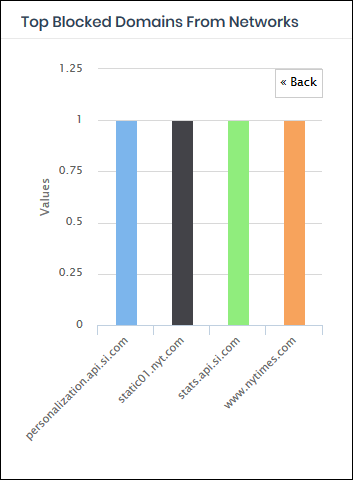
- Click 'Back' to return to the original view.
- Click a particular bar to view access requests for the domain. See 'View Logs' for more details.
Top Blocked Domains from Agents
Shows the websites that were most often blocked on your roaming devices.
- The X-axis shows the name of the domain. The Y-axis shows the number of requests from endpoints in your networks or roaming devices.
- Place your mouse cursor over a bar to view further details.
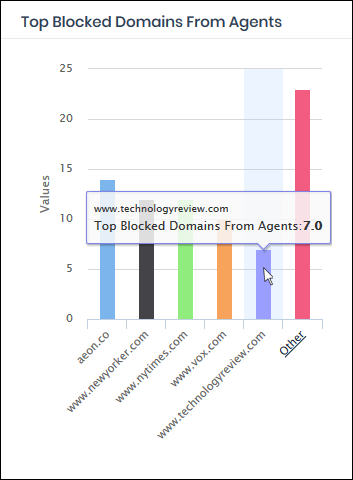
- By default, the chart shows top five domains. Click 'Other' to view the next five domains.
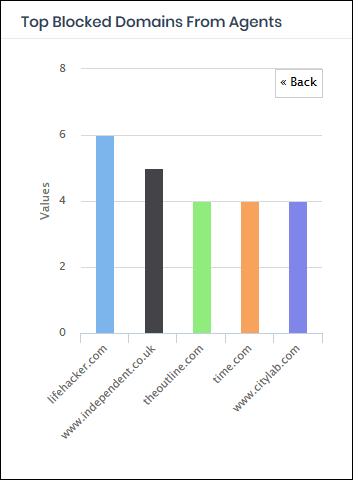
- Click 'Back' to return to the original view.
- Click a particular bar to view access requests for the domain. See 'View Logs' for more details.
Shows the number of domain access requests from all protected networks and endpoints over time.
- Results are available from the last 12 hours up to a maximum of 7 days.
- Place your mouse cursor over a point in the chart to view further details.
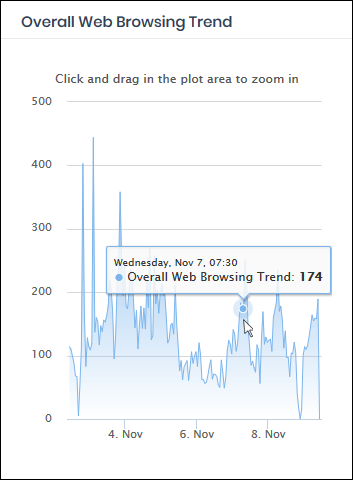
- Click and drag on the chart to zoom into a particular time period.
- Click 'Reset Zoom' to return to the full chart.
- Click a particular point on the chart to view logs of the domain access requests. See 'View Logs' for more details.
Shows the number of harmful sites blocked on your networks and endpoints by your security rules.
- Results are available from the last 12 hours up to a maximum of 7 days.
- Place your mouse cursor over a point in the chart to view further details.
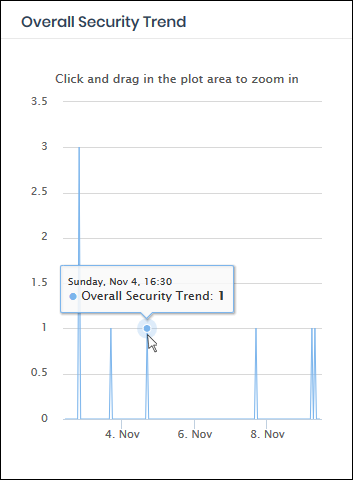
- Click and drag on the chart to zoom into a particular time period.
- Click 'Reset Zoom' to return to the full chart.
- Click a particular point on the chart to view logs of the domain access requests. See 'View Logs' for more details.
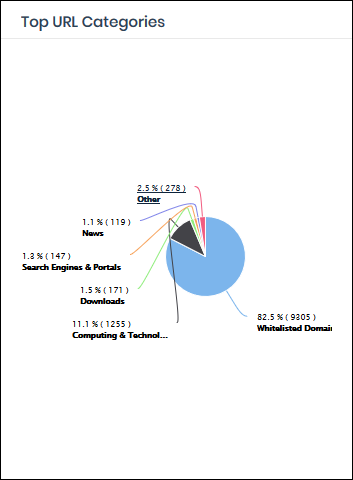
- The website categories and whitelisted domains most often visited by your users.
- Place your mouse cursor over a sector to view further details.
- Click on a sector to see a log of requested domains in that category. See 'View Logs' for more on this.
Top Target Domains of Mobile Users
Shows websites which were most often visited by mobile users in your organization.
- The X-axis shows the name of the domain. The Y-axis shows the number of requests from the mobile devices.
- Place your mouse cursor over a bar to view further details.
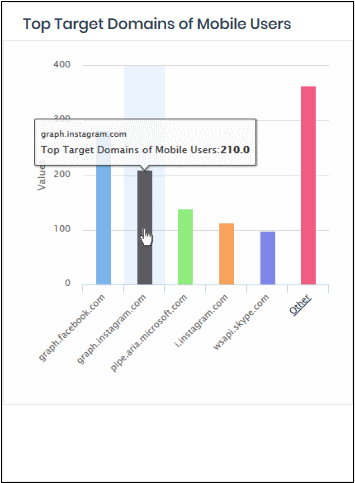
- By default, the chart shows the top five domains. Click 'Other' to view the next five domains.
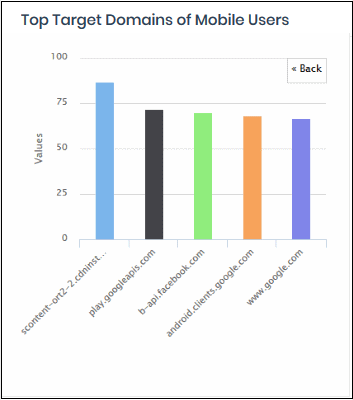
- Click 'Back' to return to the original view.
- Click a particular bar to view logs pertaining to access requests for the domain. See 'View Logs' for more details.
Show the total number of domain access requests from all mobile devices over time.
- Results are available from the last 12 hours up to a maximum of 7 days.
- Place your mouse cursor over a point in the chart to view further details.
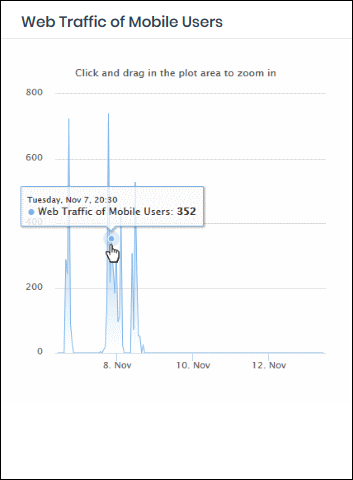
- Click and drag on the chart to zoom into a particular time period.
- Click 'Reset Zoom' to return to the full chart.
- Click a particular point on the chart to view logs of the domain access requests. See 'View Logs' for more details.
Top Blocked Categories of Mobile Users
- The website categories and blacklisted domains that were most often blocked to mobile users by category rules in your security policies.
- Place your mouse cursor over a sector to view further details.
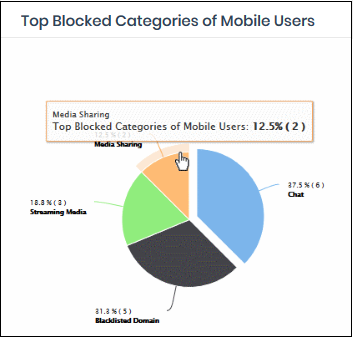
- Click on a sector to see a log of blocked categories for mobile users. See 'View Logs' for more on this.
The domains most often visited by users in networks imported by local resolvers. Results are shown for the top 10 domains.
- X-axis - Name of the domain. Y-axis - Number of requests from the network.
- Place your mouse pointer over a bar to view more details.
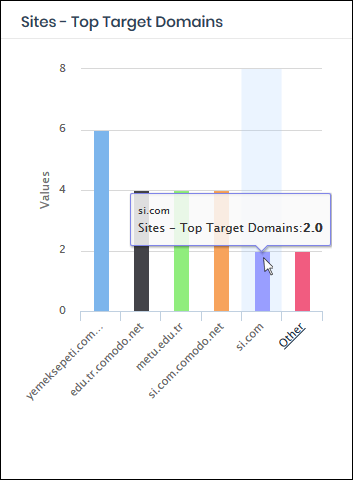
- By default, the chart shows top five domains. Click 'Other' on the right to view the next five domains.
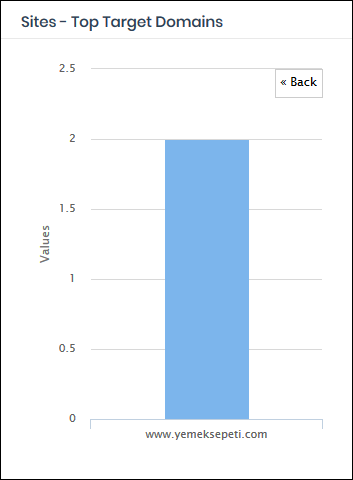
- Click 'Back' to return to the original view.
-
Click on a chart bar to view domain request logs. See 'View Logs' for more details.
Sites - Overall Web Browsing Trend
The domains most often visited by users of all endpoints imported by local resolvers.
- Results are available from the last 12 hours up to a maximum of 7 days.
- Place your mouse cursor over a point in the chart to view further details.
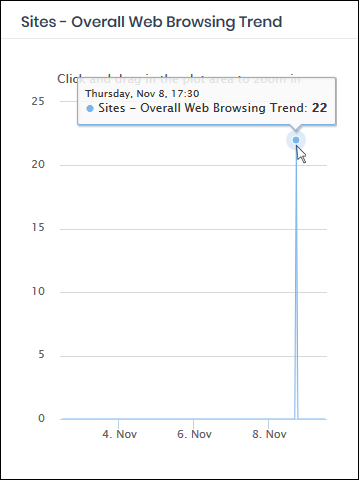
- Click and drag on the chart to zoom into a particular time period.
- Click 'Reset Zoom' to return to the full chart.
- Click a particular point on the chart to view domain request logs. See 'View Logs' for more details.
Sites - Top Blocked Categories
- Website
categories and domains that were most often blocked by
rules
- Place your mouse cursor over a sector to view further details.
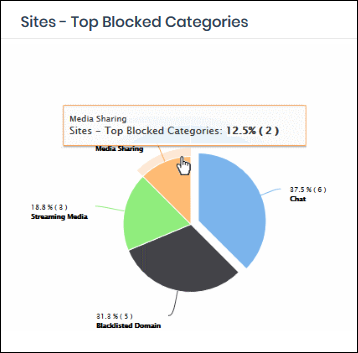
- Click
on a sector to see a log of blocked categories. See 'View
Logs' for more on this.
Top Visited Sites on CCB
Shows those websites that were most often visited in virtual sessions.
- The X-axis shows the name of the domain. The Y-axis shows the number of requests from endpoints in your networks or roaming devices.
- Place your mouse cursor over a bar to view further details.
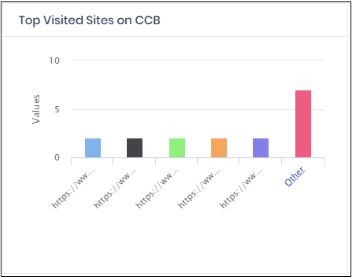
- By default, the chart shows the top five domains. Click 'Other' to view the next five domains.
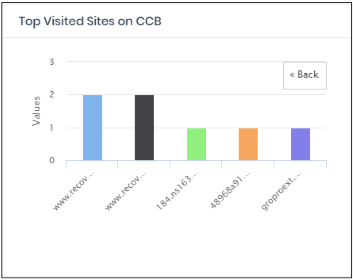
- Click 'Back' to return to the original view.
- Click a particular bar
to view access requests for the domain. See 'View Logs' for more details.
Shows devices that most often visited sites in virtual sessions.
- The X-axis shows the name of the device. The Y-axis shows the number requests.
- Place your mouse cursor over a bar to view further details.
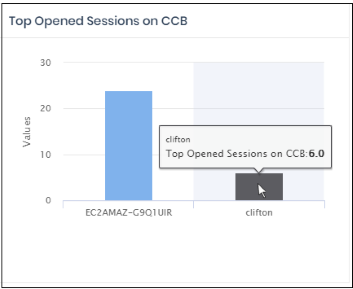
- By default, the chart shows the top five devices. Click 'Other' to view the next five devices.
- Click 'Back' to return to the original view.
- Click
a particular bar to the device virtual sessions. See 'View Logs' for more details.
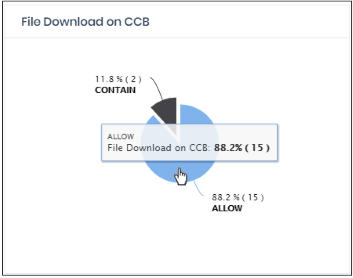
- Shows summary of files saved from virtual sessions.
- Allow – Files scanned and found safe
- Contain – Unknown / malicious files that were placed in the container (sandboxed)
- Place your mouse cursor over a sector to view further details.
- Click on a sector to view the files downloaded in that category. See 'View Logs' for more details..
