


View Logs
- You can view logs by clicking on a data item in a dashboard chart. For example, click a bar in a chart or a point on a line-graph.
- Each log shows more details about the item you clicked on. You can filter the logs by date and by various other filter types. Logs are fully searchable and can be exported to .csv.
View logs from a chart
- Click 'Overview'
- Select 'Web Overview' or 'Security Overview'
- Click on a point in the chart to view logs for that item:
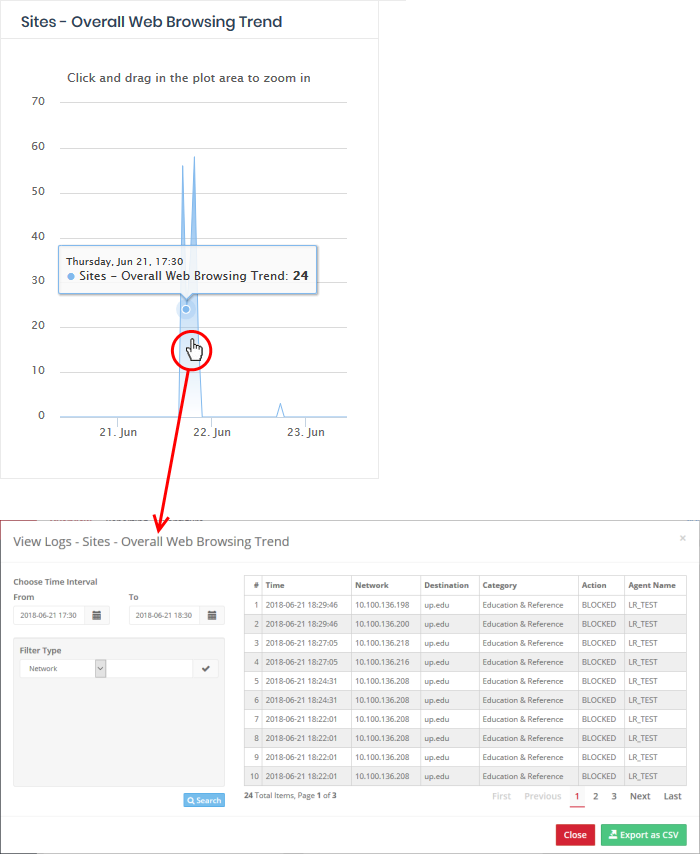
- The panel on the left lets you filter by time and other parameters.
- The right of the window lists all events in the category along with other details.
- The details on the right depend on the type of chart for which you are viewing logs. The following table show all possible columns:
|
View Logs - Table of Column Descriptions |
|
|---|---|
|
Column Header |
Description |
|
Network / Location |
The IP address of the network from which the traffic originated. Charts for networks imported by the resolver also show the IP address of the endpoint. |
|
Destination |
The name of the website the user attempted to visit. |
|
Category |
The genre of website to which the site belongs. You can view website categories in the 'Settings' area of a category rule. Click 'Configure' > 'Policy Settings' > 'Category Rules' > 'Create Category Rule' > 'Settings'. |
|
Action |
Action taken by Secure Internet Gateway. Can be 'Allowed' or 'Blocked' 'Contain'. |
|
Reason |
The reason for the action taken. For example, a website connection was 'Allowed' because the site is in an allowed category. |
|
Agent Name |
'Roaming Device' charts – This column shows the name of the roaming device. 'Imported site' charts – This column shows the name of the virtual appliance through which the network connects to Secure Internet Gateway. |
|
Domain / Target Domain |
The name of the domain that was visited / blocked. |
|
Source |
The mobile device VPN ID. |
|
Source IP |
The IP of the agent / network. |
Select Time Interval
Logs initially show data for the time period you clicked on the graph. You can change the date and time from the 'Choose Time Interval' section:
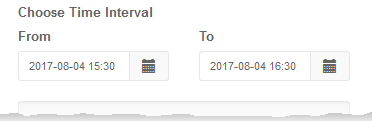
- To change the period, click the calendar icon and select the 'From' and 'To' dates or enter the period directly in the fields.
- To change the time, enter the 'From' and 'To' time in the respective fields beside the date.
Filter Options
Filter types allow you to refine the events shown as required. You can filter by multiple parameters.
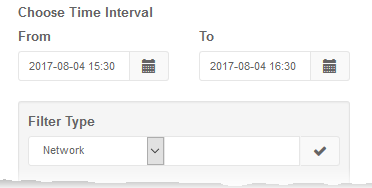
- Select a filter parameter from the drop-down. The options available depend on the type of chart
- Enter a relevant search term
- Click the check-mark to add the filter
- Repeat the process to add more filters if required
- Click 'Search':
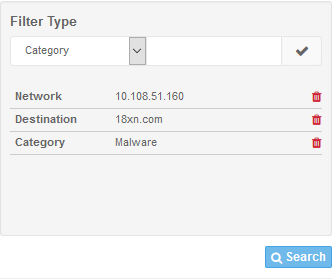
- Click the trash can icon beside a filter to remove it.
- To reset the view, delete all filters and click the 'Search' button again.
- Click 'Export as CSV' to download the logs in .csv format.
|
Chart Type |
Logs Displayed |
|---|---|
|
Web Overview Top Target Domains Top Blocked Domains Top Blocked Domains From Networks Top Blocked Domains From Agents Top Target Domains of Mobile Users Sites - Top Target
Domains Security Overview Roaming Agent Security Incidents Overall Security Incidents |
The log viewer shows details of the visited domains, network/endpoint from which the domain access request originated, the category of the domains, whether the access request was allowed or denied, and the reason for the action taken. |
|
Web Overview Roaming Agent Web Browsing Trend Overall Security Trend Web Traffic of Mobile Users Sites - Overall Web Browsing Trend Security Overview Overall Advanced Threats Roaming Agent Advanced Threats Most Blocked Mobile Threats Sites - Most Blocked Threats |
The log viewer shows details of the visited domains, network/endpoint from which the domain access request originated, the category of the domains, whether the access request was allowed or denied, and the reason for the action taken. |
|
Web Overview Top URL Categories Top Blocked Categories of Mobile Users Sites - Top Blocked Categories |
The log viewer shows details of the visited domains, network/endpoint from which the domain access request originated, the category of the domains, whether the access was allowed or denied and the reason for the action taken. |