Security Overview
The 'Security Overview' section contains data on security incidents and websites blocked by rules in your policies.
- Click 'Overview' > 'Security Overview'
The dashboard contains the following tiles:
Roaming Agent Security Incidents
Shows the number of incidents in which harmful sites were blocked on roaming devices over time.
- Results are available from the last 12 hours up to a maximum of 7 days.
- Place your mouse cursor over a point in the chart to view further details.
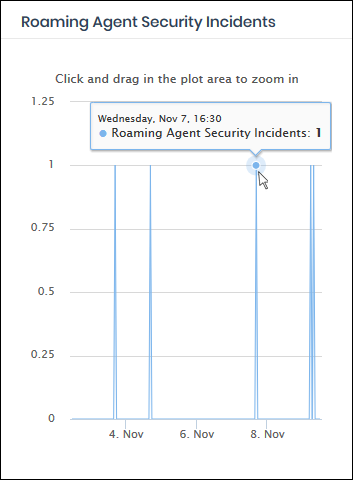
- Click and drag on the chart to zoom into a particular time period.
- Click 'Reset Zoom' to return to the full chart.
- Click a particular point on the chart to view the domain access requests. See 'View Logs' for more details.
Shows the websites that were most often blocked by your security rules. The results cover both enrolled network(s) and roaming devices.
- The X-axis shows the name of the domain. The Y-axis shows the number of requests from endpoints in your network(s) or roaming devices.
- Place your mouse cursor over a bar to view further details.
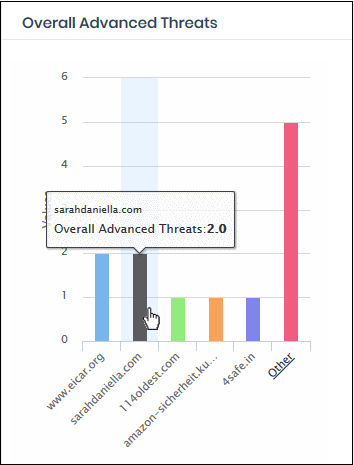
- By default, the chart shows top five domains. Click 'Other' to view the next five domains.
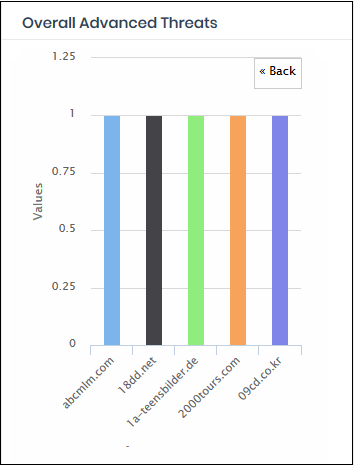
- Click 'Back' to return to the original view.
- Click a particular bar to view access requests for the domain. See 'View Logs' for more details.
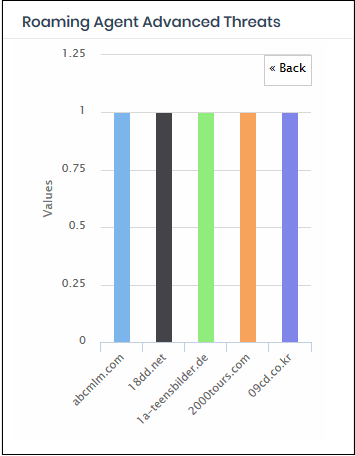
Roaming Agent Advanced Threats
Shows the sites that were most often blocked by your policies after requests from your roaming devices.
- The X-axis shows the name of the domain. The Y-axis shows the number of requests from endpoints in your networks or roaming devices.
- Place your mouse cursor over a bar to view further details.
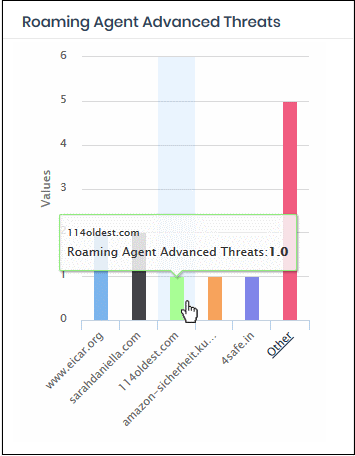
- By default, the chart shows top five domains. Click 'Other' to view the next five domains.
- Click 'Back' to return to the original view.
- Click a particular bar to view access requests for the domain. See 'View Logs' for more details.
- Shows the blocked website categories which were most often visited by your users.
- Place your mouse cursor over a sector to view further details.
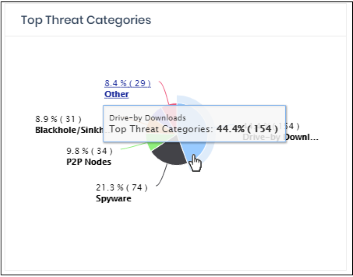
- By default, the chart shows the top five threat categories. Click the 'Other' link to view the next five categories.
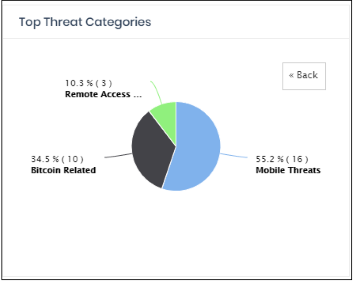
- Click 'Back' to return to the original view.
- Click a particular sector to view logs for category. See 'View Logs' for more details.
Shows the number of incidents in which harmful sites were blocked on your networks and roaming devices.
- Results are available from the last 12 hours up to a maximum of 7 days.
- Place your mouse cursor over a point in the chart to view further details.
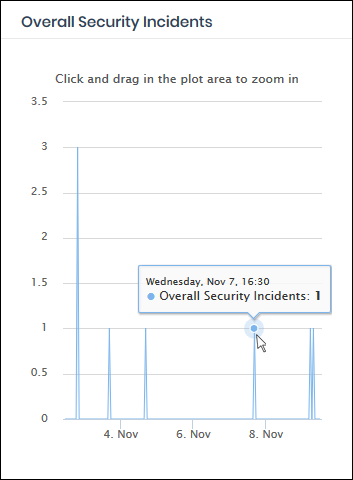
- Click and drag on the chart to zoom into a particular time period.
- Click 'Reset Zoom' to return to the full chart.
- Click a particular point on the chart to view domain access requests. See 'View
Logs' for more details.
The web categories most often blocked to mobile users by your policies. These sites usually contain threats such as malware, phishing, spy-ware and drive-by-downloads.
- Place your mouse cursor over a sector to view further details.
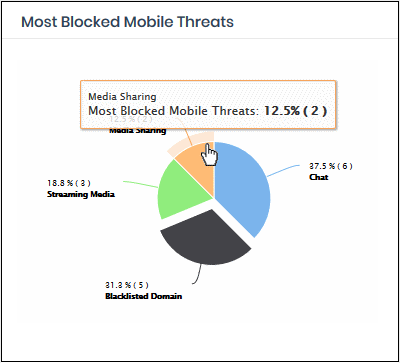
- Click on a sector to see
a log of most blocked categories for mobile users. See 'View
Logs' for more on this.
The web categories most often blocked to users on imported network sites. Categories and blacklisted domains are specified in security rules in your policies. These websites usually contain threats such as malware, phishing, spy-ware and drive-by-downloads.
- Place your mouse cursor over a sector to view further details.
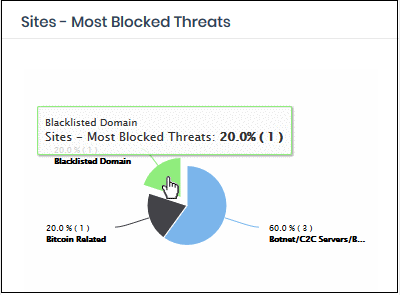
-
Click on a sector to see a log of most blocked categories for mobile users. See 'View Logs' for more on this.


