


The Dashboard
The dashboard provides a real-time overview of the current status, traffic, health and usage of the firewall.
The dashboard is displayed by default whenever you login to the console. You can access the dashboard at any time by clicking 'System' > 'Dashboard' in the left navigation.
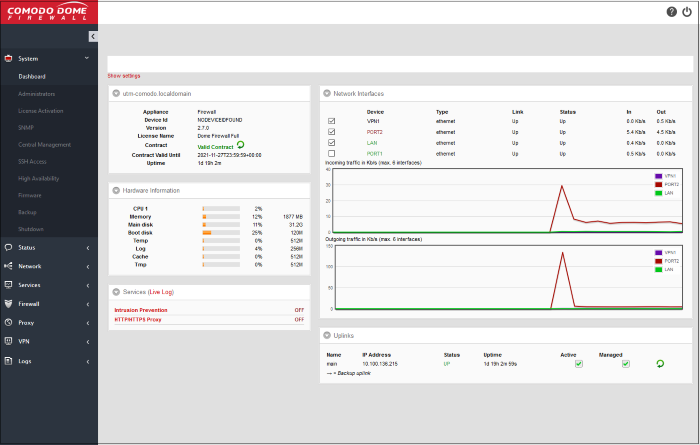
The dashboard contains five tiles which provide details on licensing/system information, hardware resource usage, currently running services, network traffic and uplink status.
- Each tile can be expanded or collapsed by clicking the arrow at top left
- The tiles can be re-positioned by dragging and dropping.
- For more details on configuring the tiles, see Configure the Dashboard
Hardware Information
The Hardware information tile shows resource usage by the firewall.
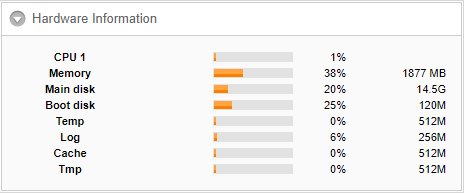
- CPU x: The usage of the CPU resources. In a multi-processor appliance, the load on each CPU is indicated separately, with the suffix 'x' denoting the CPU number.
- Memory - The usage of the system memory in the DFW.
- Main disk - Usage of the root partition of the hard disk in the DFW virtual appliance. The disk usage should not exceed 95%.
- Boot disk - Usage of the boot partition of the hard disk in the DFW virtual appliance. The disk usage should not exceed 95%.
- Temp - Usage of disk space in /tmp partition, allotted for temporary files in the DFW virtual appliance. The Temp space usage should not exceed 95%.
- Log - Usage of disk space allotted for log files in the DFW virtual appliance. The log space usage should not exceed 95%. The log files are available at /var/logs. If the log space usage exceeds the threshold, the administrator can move the log files to a different storage device and free the disk space.
- Cache - Usage of disk space for cache memory in the DFW virtual appliance.
- Tmp – Usage of disk space by .tmp files created in the appliance.
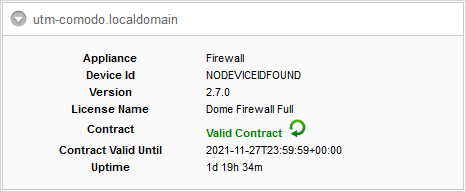
System Information
Shows the host name and the network domain to which the DFW virtual appliance is connected. The tile displays also displays general information about the virtual appliance:
-
Appliance - The type of virtual appliance
- Device ID – The identification number of the appliance
-
Version - The version number of the DFW firmware installed on the device
- License
Name – The type of license
- Contract – Indicates whether the license of the firmware is valid. Click the circled arrow to refresh the information
- Contract Valid Until – Expiry date of the license
- Uptime – Indicates the period for which the appliance is Up since the last reboot
Services
Shows the On/Off status and statistics about currently loaded services. Services can include intrusion detection and mail filters.
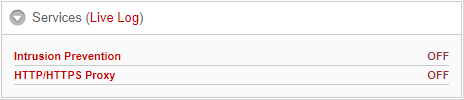
- Click the Live Log in the title bar to open the Realtime logs screen.
- Click the service name to view detailed statistics.
- Attacks Logged - Shows the number of attacks logged by the DFW
- SMTP Proxy - Shows the statics of mails in queue, total mails received, clean mails and infected mails that were rejected
- HTTP/HTTPS Proxy - Shows the statics of cache hits and misses
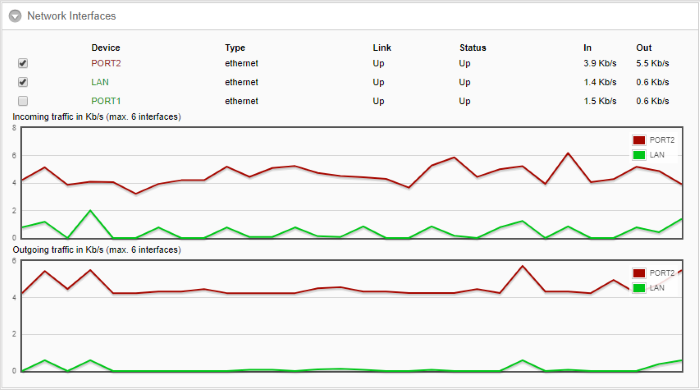
Network Interfaces
Shows network interface devices connected to the firewall and realtime charts of incoming and outgoing traffic through these devices.
|
Network Interfaces – Column Descriptions |
|
|---|---|
|
Column Header |
Description |
|
Device |
The name of the network interface device. The font color indicates the network zone to which the device belongs: Yellow - DMZ zones Green – LAN networks Blue - Wi-Fi networks |
|
Type |
Connection type. For example, ethernet or wi-fi. |
|
Link |
Whether the connection is active or not. |
|
Status |
Running status of the device. |
|
In/Out |
Incoming/Outgoing traffic through the device. |
The lower half of the tile shows realtime charts of incoming and outgoing traffic through the devices selected in the upper half.
For more information on managing network interface devices, see Network Configuration.
The uplinks area shows defined IP addresses through which the virtual appliance connects to the internet.
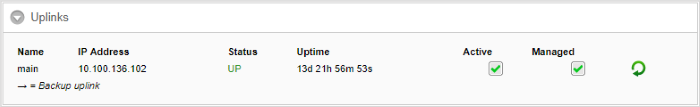
The table shows the connection status and running status of each uplink and allows the administrator to enable or disable them. For more details on managing uplinks, see Add and Manage Gateway Uplink Devices.
|
Uplinks – Column Descriptions |
|
|---|---|
|
Column Header |
Description |
|
Name |
The name of the uplinks defined in DFW. |
|
IP Address |
IP Address of the uplink. |
|
Status |
Running status of the uplink. The status column can have one of the following values: Stopped or Inactive - The uplink is not connected to DFW virtual appliance. Connecting - The uplink is connecting to the appliance, but connection is not yet complete Connected or UP - The connection has been established and operational. Disconnecting - The uplink is closing the connection Failure – The connection could not be completed Failure, reconnecting - The connection could not be completed, but the appliance is attempting to reconnect again. Dead link- The uplink is connected, but the defined hosts could not be reached. The uplink is not operational. |
|
Uptime |
The period the uplink has been active since the last reboot. |
|
Active |
Whether the uplink is on or not. You can switch the uplink between enabled and disabled states by selecting/deselecting this checkbox |
|
Managed |
Shows whether the uplink is managed by DFW or manually managed. Admins can switch between states by selecting or deselecting the checkbox. In 'Managed' mode, the uplink will be continuously monitored and reconnected whenever there is a loss in connectivity. During testing or maintenance, the uplink can be switched to manual mode.
|
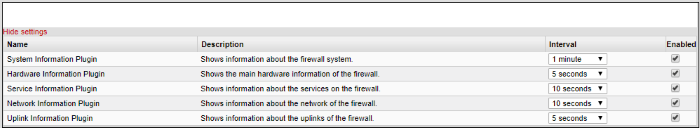
Dome Firewall uses dashboard plug-ins to fetch the statistical information from different components of the DFW and displays them as tiles in the dashboard. The plug-ins gather the updated information periodically at specified intervals. The administrator can configure the interval at which the statistical information from each component is fetched and enable/disable the plug-ins, and hence the corresponding tile, from the Dashboard settings pane.
To open the Dashboard Settings pane
- Click 'Show Settings' link at the top left of the Dashboard.
|
Dashboard Settings - Column Descriptions |
|
|---|---|
|
Column Header |
Description |
|
Name |
The name of the plugin. |
|
Description |
A short description of the plug-in. Indicates the component of the DFW for which the plug-in fetches the information. |
|
Interval |
Enables the administrator to set the time interval at which the plug-in should refresh the information and show in the corresponding tile, be selecting the interval from the drop-down. |
|
Enabled |
The checkboxes enable the administrator to enable or disable the plug-in. Only the tiles corresponding to enabled plug-ins are displayed in the dashboard. If a tile needs to be hidden, the corresponding plug-in can be simply disabled. |
- Set the refresh intervals and enabled/disabled states of the plug-ins as desired
- Click 'Save' for your changes to take effect
- To close the settings pane, click 'Hide Settings' link at the top left.