Comodo Help
Find the desired product help
Comodo Secure Box

Comodo Secure Box

SecureBox Management Console Admin Guide

English

Print Help Download Help
The Home Screen
  • Introduction To Comodo SecureBox
    • Initial Setup
    • Quick Start
    • Login To The Management Console
  • The Central Management Console
  • The Home Screen
  • Manage Organizations
    • Add A New Organization
    • Edit And Deactivate An Organization
  • Users And User Groups
    • Manage Users
    • Manage User Groups
  • Endpoints And Endpoint Groups
    • Manage Endpoints
      • Enroll Endpoints For Management
      • Assign Endpoints To Groups
      • Quarantine Endpoints
      • Delete Endpoints
    • Manage Endpoint Groups
      • Create A New Endpoint Group
      • Edit Endpoint Groups
  • Policies
    • Manage Policies
      • Create A New Policy
      • Edit A Policy
  • Configure The Management Console
  • Reports
    • Threats Report
    • Activity Report
  • License Information
  • Management Console Details And Support
  • About Comodo Security Solutions

The Home Screen


The 'Home' screen contains a snapshot of your SecureBox deployment, showing pie charts of managed/discovered endpoints and detected threats. Threats are also displayed as a bar graph for each category and on which endpoints they were detected.


The 'Home' screen will be displayed by default after logging-in to the console. You can also return here by clicking ‘Home’ at the top of the interface.


Deployment Status


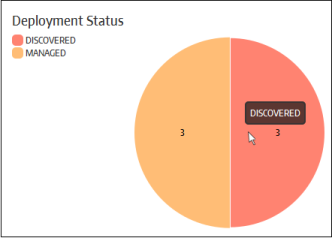
The 'Deployment Status' pie chart displays a summary of endpoints on customer networks. The 'Discovered' segment includes endpoints that were scanned in the network and discovered via Work Group, Active Directory and Network Address. These discovered endpoints will become managed after the CSB package is deployed and accepted by the administrator. The 'Managed' segment provides the number of endpoints on which the SB application is installed and connected to the console. Placing the mouse cursor over a sector displays the respective details.


Detected Threats


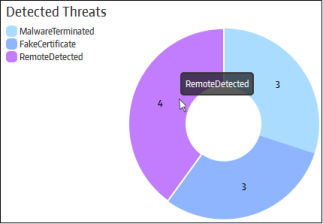
The 'Detected Threats' chart displays an overview of threats encountered by Secure Box on your managed endpoints. The threats displayed here depend on the protection settings defined in your SecureBox policies. Refer to the section 'Policies' for more details. Place your mouse cursor over a sector to view more details.


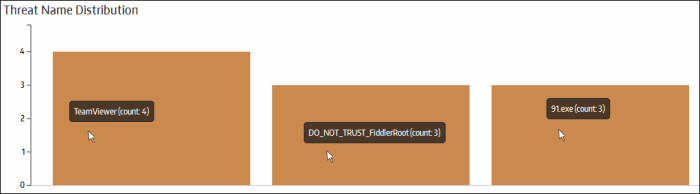
The bar graphs below the pie chart section provide further details about detected threats. These include the number of each type of threat and the details of the endpoints on which they were detected.Placing your mouse cursor over a graph displays more details.


An example of bar graph for a detected threat:


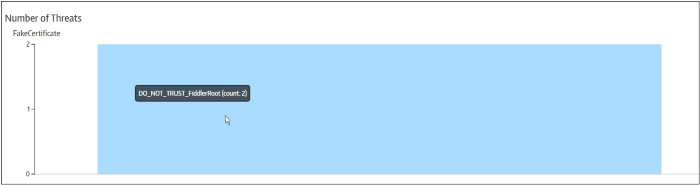
An example of bar graph displaying the details of endpoints on which a threat was detected:


Detected threats in graphical format:


Our Products
  • Free Antivirus
  • Free Internet Security
  • Website Malware Removal
  • Free Anti-Malware
  • Anti-Spam (Free Trial)
  • Windows Antivirus
  • Antivirus for Windows 7
  • Antivirus for Windows 8
  • Antivirus for Windows 10
  • Antivirus for MAC
  • Antivirus for Linux
  • Free Endpoint Security
  • Free ModSecurity
  • Free RMM
  • Free Website Malware Scanner
  • Free Device Manager for Android
  • Free Demo
  • Network Security
  • Endpoint Protection
  • Antivirus for Android
  • Comodo Antivirus
  • Wordpress Security
Cheap CDN
  • Bootstrap CDN
  • Semantic UI CDN
  • Jquery CDN
  • CDN Plans
  • CDN
  • Free CDN
Enterprise
  • Patch Management Software
  • Patch Manager
  • Service Desk
  • Website Down
  • Endpoint Protection Solutions
  • Website Security Check
  • Remote Monitoring and Management
  • Website Security
  • Device Manager
  • ITSM
  • CRM
  • MSP
  • Android Device Manager
  • MDR Services
  • Managed IT Support Services
  • Free EDR
Free SSL Certificate
Support Partners Terms and Conditions Privacy Policy

© Comodo Group, Inc. 2025. All rights reserved.